What we learnt from US Earnings season, and why MOATs matter going forward
A better-than-expected second quarter earnings season sparked a sharp rally in US stocks in July. Quarter two earnings results surprised to the upside by 4 per cent with 84 per cent of S&P 500 companies by market capitalization having reported. Earnings per share (EPS) beats outweighed misses by 18 per cent, (±5 per cent against estimates) and trailing 12 month EPS grew 10 per cent year-on-year.
Chart 1 – S&P 500 Earnings per share surprise by index weight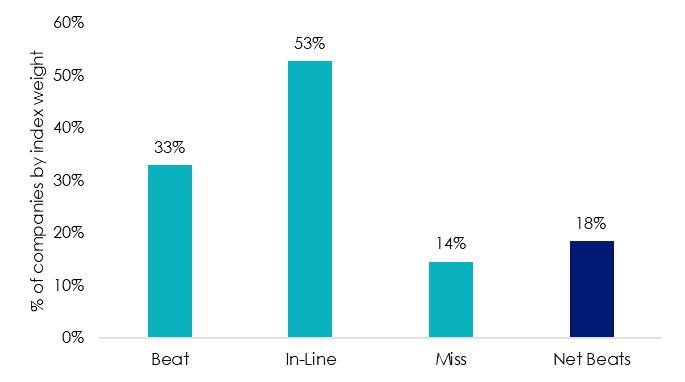
Source: Bloomberg, As at 4 August 2022. Beats where company EPS ahead of estimates by more than 5 per cent.
While earnings results at a headline level are a positive sign for the US economy, the case for volatility versus a rebound with staying power is still strong. Many analysts maintain a gloomy outlook for the global economy, predicting a period of low growth and high inflation in the near term. According to Morgan Stanley, while prices to the end consumer are still rising at a rapid clip, prices for producers are rising at double the pace. Economic headwinds have seen earnings per share forecasts revised down, and markets have priced in this slowdown as shown in Chart 3. S&P 500 year-on-year (YoY) price change is ahead of EPS forward revisions.
Investors may want to consider positioning themselves in companies with wide economic moats to help defend against further volatility.
Chart 2 – Producer less consumer inflation costs YoY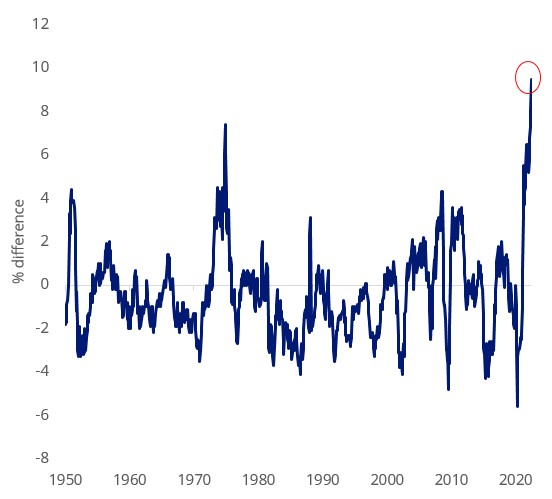
Source: Bloomberg.
Chart 3 - US 12m Earnings per share growth versus performance YoY
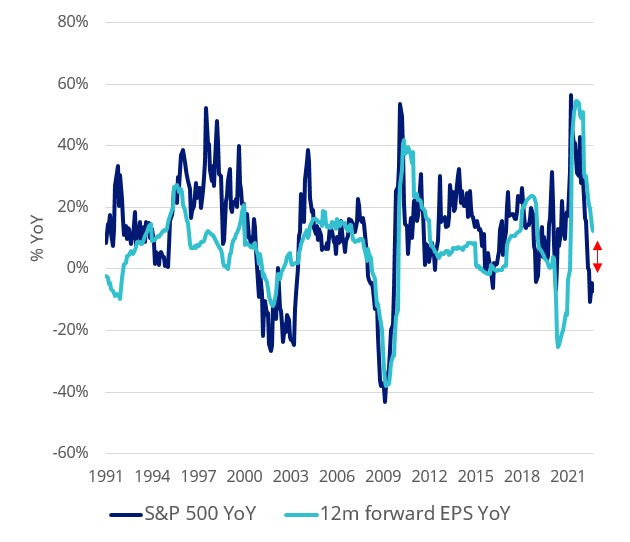
Source: Bloomberg.
Despite the uncertain outlook, the market drawdown in 2022 has improved valuations based on forward estimates across a variety of metrics, and, companies with strong pricing power (economic moats) should be better positioned to defend against challenges over the next 12 months. Businesses with economic moats have the ability to pass on higher production costs to consumers while maintaining healthy business margins. Investing with a wide moat is investing in companies with structural barriers that protect profits and defend against competition.
An example of a company with a wide economic moat is Microsoft (MOAT) it has highly recurring cash flows, great margins and low financial leverage with little risk. Microsoft’s intellectual property, specifically its patents and proprietary software code contribute to the depth of its moat.
US listed company valuations attractive as represented by S&P 500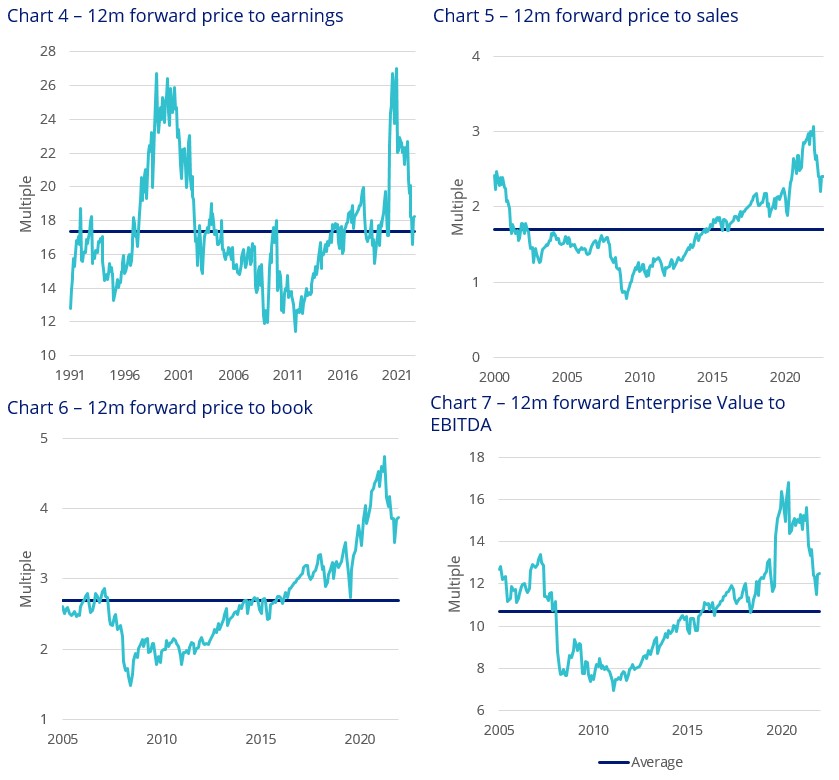
Source: Bloomberg.
Morningstar has turned a well-known philosophy of investing in economic moats into an actionable strategy by identifying companies with a sustainable competitive advantage. The concept of economic ‘moats’ was first popularised by Warren Buffett. Buffett is quoted as saying, "In business, I look for economic castles protected by unbreachable 'moats'”.
Morningstar has identified five sources of moat;
- Cost advantage: Allows companies to sell at the same price as competition and gather excess profit and/or have the option to undercut competition.
- Switching costs: Whether in time or money, the expenses that a customer would incur to change from one producer/provider to another.
- Network effect: Present when the value of a service grows as more people use a network.
- Intangible assets: Things such as brands, patents, and regulatory licenses that block competition and/or allow companies to charge more.
- Efficient scale: When a company serves a market limited in size, new competitors may not have an incentive to enter.
Access to economic moats
VanEck Morningstar Wide Moat ETF (ASX ticker: MOAT) tracks the Morningstar® Wide Moat Focus Index™ (MOAT Index) that is a rules-based, equal-weighted index intended to offer exposure to attractively priced US companies with sustainable competitive advantages according to Morningstar’s equity research team.
Moat investing has served Australian investors well. Since its inception, MOAT has outperformed the S&P 500 Index – testament to MOAT’s value and quality approach. Though we always caution past performance is not a reliable indicator of future performance.
Chart 8 - Cumulative performance since MOAT ASX listing date
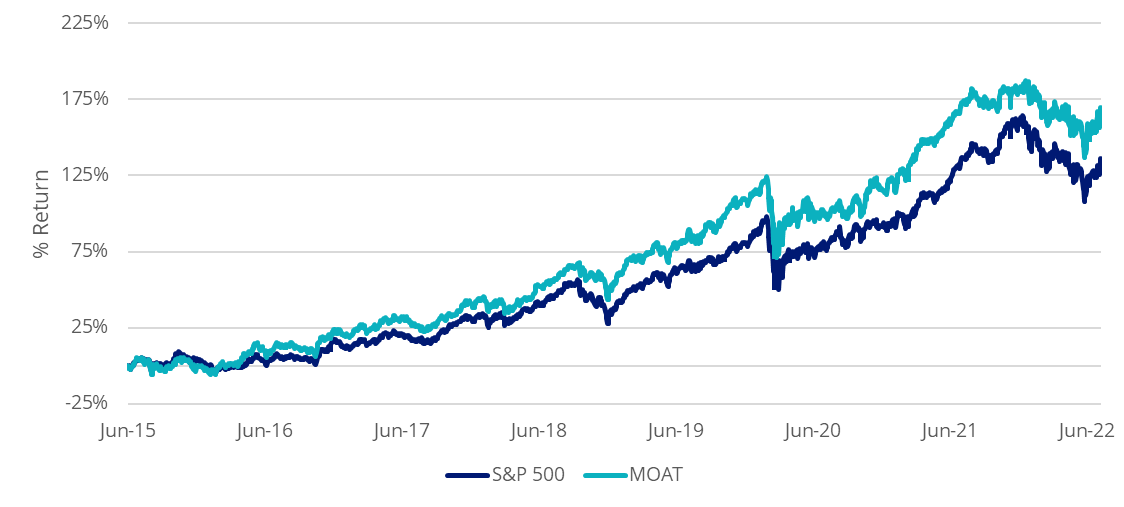
Table 1 – Trailing performance
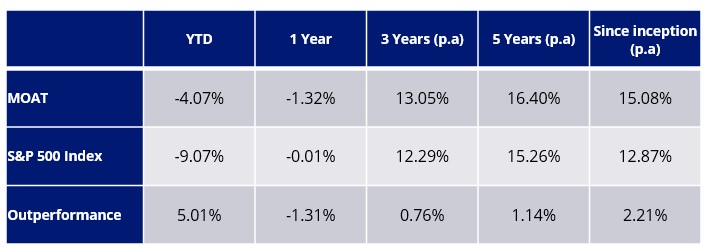
*ASX Inception date is 26 June 2015
Chart 8 and Table 2 source: Morningstar Direct, VanEck as at 31 July 2022. The chart and table above show past performance of MOAT and of the S&P500 Index. You cannot invest directly in an index. Results are calculated to the last business day of the month and assume immediate reinvestment of distributions. MOAT results are net of management fees and other costs incurred in the fund, but before brokerage fees and bid/ask spreads incurred when investors buy/sell on the ASX. Returns for periods longer than one year are annualised. Past performance is not a reliable indicator of future performance. The S&P 500 is shown for comparison purposes as it is the widely recognised benchmark used to measure the performance of the broad US equities market. It includes the 500 largest US listed companies, weighted by market capitalisation. MOAT’s index measures the performance of 40 to 80 US companies with a Morningstar Economic Moat Rating™ of “Wide”. MOAT’s index has fewer securities and different industry allocations than the S&P 500.
VanEck also offers two Morningstar economic moat strategies namely VanEck Morningstar International Wide Moat ETF (ASX ticker: GOAT) and VanEck Morningstar Australian Moat Income ETF (ASX ticker: DVDY) for investors looking for global equity and Australian equity income investment strategies respectively.
Key risks
An investment in MOAT carries risks associated with: financial markets generally, individual company management, industry sectors, ASX trading time differences, foreign currency, country or sector concentration, political, regulatory and tax risks, fund operations and tracking an index. See the PDS for details.
Note - There is no suggestion that Warren Buffett endorses the Morningstar Wide Moat Focus Index or MOAT ETF.


Published: 14 August 2022
Any views expressed are opinions of the author at the time of writing and is not a recommendation to act.
VanEck Investments Limited (ACN 146 596 116 AFSL 416755) (VanEck) is the issuer and responsible entity of all VanEck exchange trades funds (Funds) listed on the ASX. This is general advice only and does not take into account any person’s financial objectives, situation or needs. The product disclosure statement (PDS) and the target market determination (TMD) for all Funds are available at vaneck.com.au. You should consider whether or not an investment in any Fund is appropriate for you. Investments in a Fund involve risks associated with financial markets. These risks vary depending on a Fund’s investment objective. Refer to the applicable PDS and TMD for more details on risks. Investment returns and capital are not guaranteed. The Morningstar® Wide Moat Focus Index™ was created and is maintained by Morningstar, Inc. Morningstar, Inc. does not sponsor, endorse, issue, sell, or promote the Fund and bears no liability with respect to the Fund or any security. Morningstar®, Morningstar Wide Moat Focus Index™, and Economic Moat™ are trademarks of Morningstar, Inc. and have been licensed for use by VanEck.
Effective June 20, 2016, Morningstar implemented several changes to the Morningstar® Wide Moat Focus Index™ construction rules. Among other changes, the index increased its constituent count from 20 stocks to at least 40 stocks and modified its rebalance and reconstitution methodology. These changes may result in more diversified exposure, lower turnover and longer holding periods for index constituents than under the rules in effect prior to this date.