Beyond the benchmark: A comparison of MOAT, NASDAQ-100 & S&P 500
The stock market of the biggest economy in the world has both inspired Australian investors in allocating their wealth to household names such as Google, Microsoft, 3M and Walt Disney but also diversified their portfolios to the economic and sector opportunities underrepresented in Australia. Here we provide some insightful analysis for our popular US equity Morningstar Wide Moat ETF (MOAT) versus the benchmarks that represent US markets, the S&P 500 Index and the NASDAQ-100 Index.
The three most followed stock market indices in the US are the Dow Jones Industrial Average (Dow Jones), the S&P 500 Index (S&P 500), and the NASDAQ-100 Index (NASDAQ-100).
Many market indices, including these, are an accident of history. They were not initially designed for investment purposes, rather they were created to provide an update, or a health check of the market.
When Charles Dow first published the Dow Jones in 1896, he allocated weightings to the top 12 stocks of the day based on their prices.
The Dow Jones is still widely quoted today. Let’s take a look at how it is constructed. It is a price-weighted index, which means that the stocks with the highest price have the largest weighting. Currently, UnitedHealth Group, which has a price of US$485 per share, has the highest weighting in the portfolio. Let’s contrast that with Apple. Apple is a company that is five times larger than UnitedHealth, yet it only makes up 3.2% of the Dow Jones compared to the 9.6% of UnitedHealth.
The Dow Jones provides a general barometer of US equity performance, but does not make any sense from an investment perspective because a share price could be a function of having less (or more) shares on issue.
As a result, the next index innovation was ‘market capitalisation’, which was pioneered by Henry Varnum Poor and the Standard Statistics Co. The result was the 1926 predecessor of the United States’ S&P 500. A market capitalisation index uses the size of a company for inclusion. Therefore, in a market capitalisation index, the larger companies have bigger weights. In the S&P 500, Apple makes up around 6.1%, UnitedHealth around 1.4%. Market capitalisation indices were considered better barometers of the market. Again though, the intention of the index is to be a market barometer, not a tool for investment.
From its beginning in 1971 the NASDAQ, initially an acronym for the National Association of Securities Dealers Automated Quotations, has grown to become the most active share trading markets in the US by volume and is ranked second by size behind the New York Stock Exchange. NASDAQ has been known for innovation. For example, in 1998 it became the first share market in the United States to trade online, using the slogan "the stock market for the next hundred years" and it attracted many companies in the dot-com bubble.
The NASDAQ Composite includes nearly all the companies listed on the NASDAQ stock exchange. Like the S&P 500 it is a market capitalisation index. The composition of the NASDAQ composite is heavily weighted to information technology companies. NASDAQ created two other indices, the NASDAQ Financial-100 Index, which includes the 100 largest financial companies listed on NASDAQ and the NASDAQ-100 which includes the largest NASDAQ-listed 100 companies from all the sectors, ex financials. The NASDAQ-100, like the S&P 500 has also become one of the most followed share market indices.
The rise of passive investing, including the growth of ETFs, has resulted in many funds tracking these well-known indices. Funds that track market capitalisation indices allocate more to bigger companies than smaller companies. So, when the market overvalues a company, a fund tracking that index buys too much of the overpriced company. Conversely when the market undervalues a company, the fund sells too much of the under-priced company. In other words, tracking market capitalisation indices can result in “buying high” and “selling low”. The opposite of what investors want.
Innovative indices beyond market capitalisation
The next innovations in index design has been driven by a combination of the demand by investors to seek investment outcomes beyond benchmarks and the advent of technologies such as ‘big data’ that enabled financial professionals to better leverage financial reports, performance data points and mathematical algorithms to target these outcomes.
Unlike market capitalisation indices, these indices are created with an investment outcome in mind, rather than to represent the performance or health of the share market.
These new indices allow passive funds to target investment outcomes, like outperformance above market benchmark returns over the long term, while retaining low costs. It is this approach that VanEck offers, that is being used by savvy investors as a way to invest in US equities.
VanEck has collaborated with Morningstar to bring a unique approach to Australian investors.
Morningstar has turned a well-known investment philosophy and approach into an actionable investment strategy. This philosophy is based on the concept of economic ‘moats’ that was popularised by Warren Buffett. Buffett is quoted as saying, "In business, I look for economic castles protected by unbreachable 'moats'." To Buffett, the castle is the business and the moat is its competitive advantage: The wider the moat, the more sustainable the business.
Morningstar assigns each company it analyses an Economic Moat Rating of ‘wide’, ‘narrow’ or ’none’. Companies assigned a wide moat rating are those in which Morningstar has very high confidence that excess returns will remain for 10 years, with excess returns more likely than not to remain for at least 20 years. Companies with a narrow moat rating are those Morningstar believes are more likely than not to achieve normalised excess returns for at least the next 10 years. A firm with either no sustainable competitive advantage or one that Morningstar thinks will quickly dissipate is assigned a moat rating of ‘none’.
Our US equity ETF (MOAT) tracks the Morningstar® Wide Moat Focus Index™ (MOAT Index) that is a rules-based, equal-weighted index intended to offer exposure to attractively priced companies with sustainable competitive advantages according to Morningstar’s equity research team.
So, let’s walk through the difference between MOAT, the NASDAQ-100, and the market capitalisation index for US equities, the S&P 500.
Fundamentals comparison: MOAT, NASDAQ-100 & S&P 500
Table 1: Statistics and fundamentals
|
|
MOAT |
NASDAQ-100 |
S&P 500 |
|
Index strategy |
Market capitalisation weight |
Market capitalisation weight |
|
|
Number of holdings |
49 |
100 |
500 |
|
Sectors |
9 |
7 |
11 |
|
12mth trailing Dividend Yield |
1.36% |
1.00% |
1.71% |
|
Dividend frequency |
Annually |
-- |
-- |
|
Return on equity (ROE) (%) |
25.15 |
32.21 |
27.60 |
|
Financial leverage (debt to equity) (x) |
1.19 |
1.21 |
1.31 |
|
Price to earnings (x) |
21.88 |
23.77 |
19.22 |
|
Price to book (x) |
3.55 |
5.69 |
3.60 |
|
Price to Sales (x) |
3.08 |
3.67 |
2.42 |
Source: FactSet, as at 30 December 2022. You cannot invest directly in an index. Past performance is not a reliable indicator of future performance.
As you would expect, MOAT has lower debt to equity and is more attractive on a price to sales and price to book value perspective. It is worth noting, that while being known for information technology, the NASDAQ-100 has exposure to six other equity market sectors. These other six sectors represent roughly half of the index.
Performance: MOAT, NASDAQ-100 & S&P 500
Moat investing has served Australian investors well. Since its inception on ASX in 2015, MOAT has outperformed the S&P 500 Index – testament to MOAT’s value and quality approach. Despite recent outperformance, over the long term it has underperformed the tech-heavy NASDAQ-100.
Chart 1: Cumulative performance since MOAT ASX listing date to 25 January 2023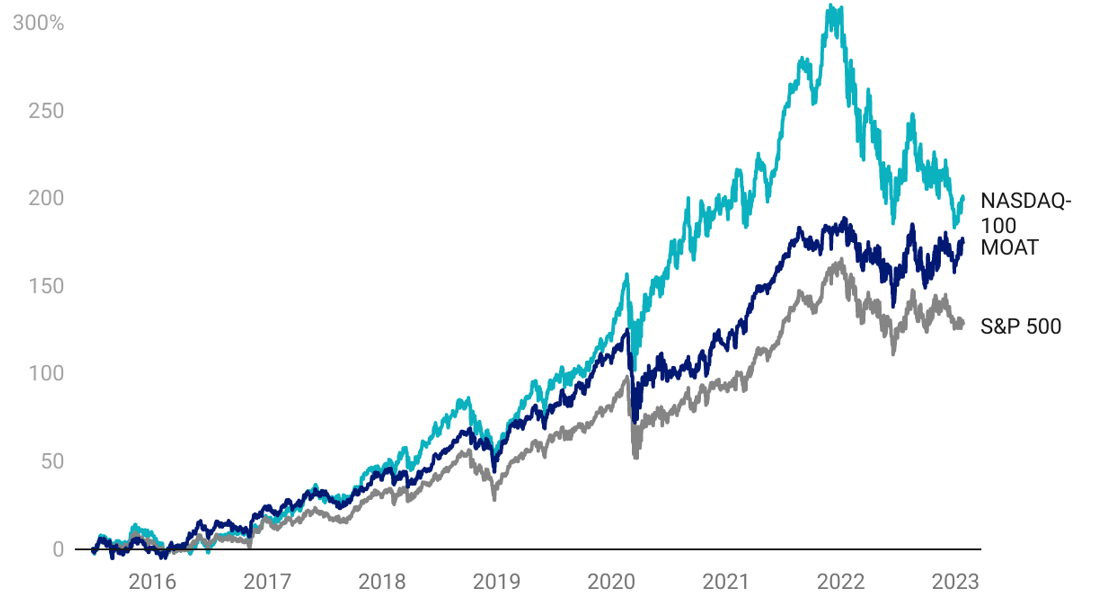
Table 2: Trailing performance to 25 January 2023
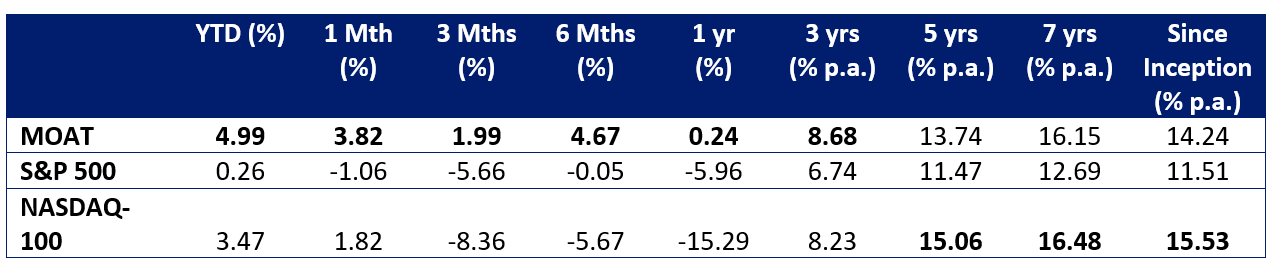
*ASX Inception date is 26 June 2015.
Chart 1 and Table 2 source: Morningstar Direct, VanEck. The chart and table above show past performance of MOAT, the S&P500 Index and the NASDAQ-100 Index. You cannot invest directly in an index. Results are calculated to the last business day of the month and assume immediate reinvestment of distributions. MOAT results are net of management fees and other costs incurred in the fund, but before brokerage fees and bid/ask spreads incurred when investors buy/sell on the ASX. Returns for periods longer than one year are annualised. Past performance is not a reliable indicator of future performance. The S&P 500 and NASDAQ-100 are shown for comparison purposes as they are widely recognised benchmarks used to measure the performance of the broad US equities market. They includes the 500 largest US-listed companies and the largest 100 NASDAQ-listed companies (ex-financials), weighted by market capitalisation. MOAT’s index measures the performance of 40 to 80 US companies with a Morningstar Economic Moat Rating™ of “Wide”. MOAT’s index has fewer securities and different industry allocations than the S&P 500 and the NASDAQ-100. Click here for more details.
Risk of loss: MOAT, NASDAQ-100 & S&P 500
The returns noted above must be considered with the risks taken to achieve those returns. There are a number of ways to measure risk, but for most investors the risk of loss is the true risk they consider. To understand how a strategy could perform in the current environment, a risk measure called ‘drawdown’ demonstrates both the depth of a fall from an historical peak and the pace of the recovery to a new peak. It is a measure of loss and recovery. The maximum drawdown is the distance from the highest peak to the deepest valley. Investments that fall less and recover faster are more desirable.
The chart below shows the drawdown of the MOAT versus the S&P500 and the NASDAQ-100. You can see the NASDAQ-100’s largest drawdown is over 30%. This is much bigger falls than those experienced by MOAT and the S&P 500.
Chart 2: Drawdown since MOAT ASX listing date to 25 January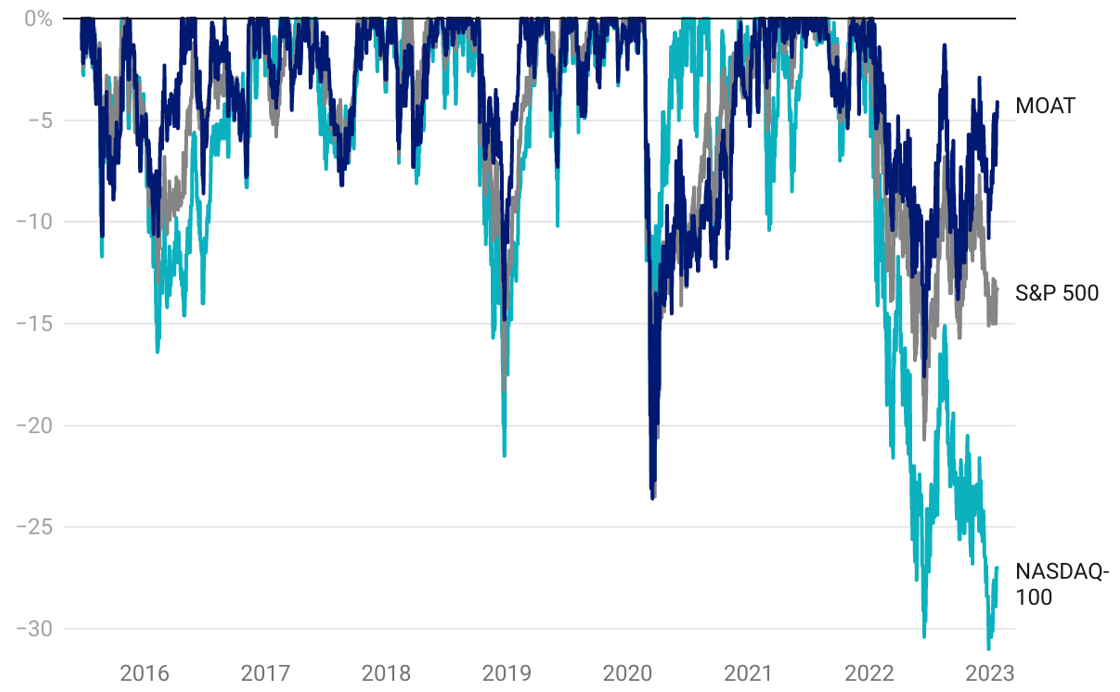
Chart 2 source: Morningstar Direct, VanEck. The chart above shows the drawdown of MOAT, the S&P500 Index and the NASDAQ-100 Index. You cannot invest directly in an index. Results are calculated to the last business day of the month and assume immediate reinvestment of distributions. MOAT results are net of management fees and other costs incurred in the fund, but before brokerage fees and bid/ask spreads incurred when investors buy/sell on the ASX. Returns for periods longer than one year are annualised. Past performance is not a reliable indicator of future performance. The S&P 500 and NASDAQ-100 are shown for comparison purposes as they are widely recognised benchmarks used to measure the performance of the broad US equities market. They include the 500 largest US-listed companies and the largest 100 NASDAQ-listed companies (ex-financials), weighted by market capitalisation. MOAT’s index measures the performance of 40 to 80 US companies with a Morningstar Economic Moat Rating™ of “Wide”. MOAT’s index has fewer securities and different industry allocations than the S&P 500 and the NASDAQ-100. Click here for more details.
Top 10 holdings: MOAT, NASDAQ-100 & S&P 500
It has been well documented that the top 10 of the S&P 500 and NASDAQ-100 have been the drivers of much of the growth of those indices. This has led to some unintended concentration within that index, as well as valuation concerns.
Below you can see the top 10 companies. The NASDAQ-100 is highly concentrated with its top 10 representing over 50% of the index. That means 90 companies squeezed into the remaining portion of the portfolio. Investors in a portfolio of 100 companies may expect more diversification than that. Likewise, despite having a tenth of the number of holdings of the S&P 500, MOAT’s total top 10, as a percentage of its portfolio is close to the total top 10 of the broad market index that includes 490 other companies. Many of the smaller-sized companies in the S&P 500 and NASDAQ-100 do not contribute much to portfolio performance – to see all the holdings in MOAT and their weightings click here.
Table 3: Top 10 holdings MOAT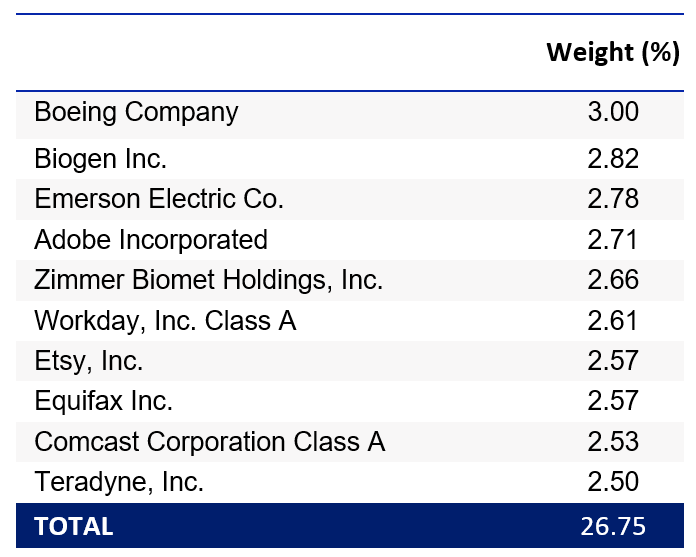
Table 4: Top 10 holdings NASDAQ-100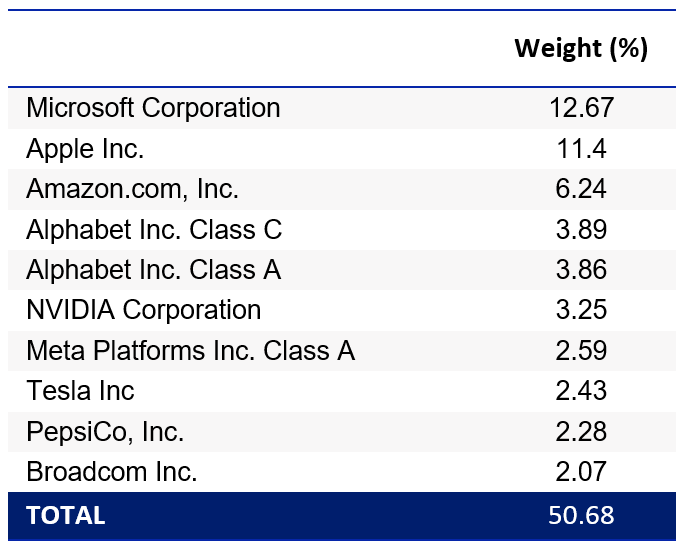
Table 5: Top 10 holdings S&P 500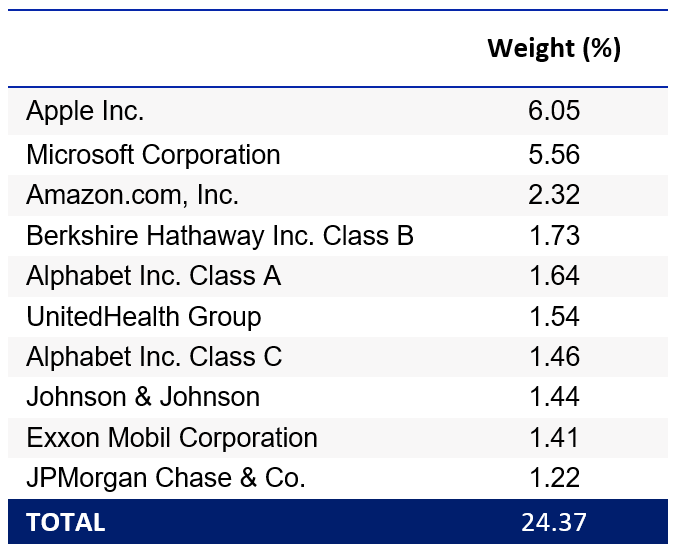
Table 3, 4 and 5 sources: VanEck, S&P FactSet, as at 30 December 2022.
MOAT vs S&P 500 Index - Style
When looking at portfolios it is important to determine what style e.g. value or growth and what size bias a portfolio holds e.g. giant, large, mid or small. Below we can see MOAT’s. Importantly MOAT holds large companies with a similar core orientation relative to the S&P 500 index. The NASDAQ-100 has a giant- growth bias.
Chart 3: MOAT holdings based style map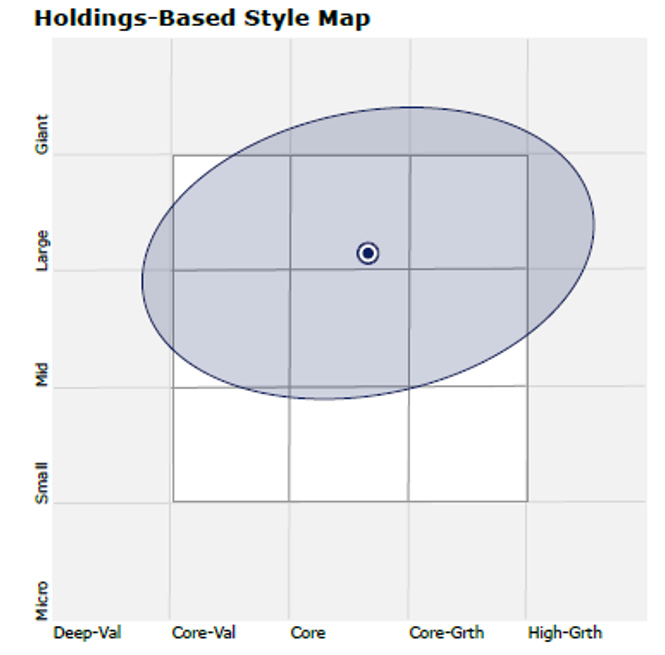
Chart 4: NASDAQ-100 holdings based style map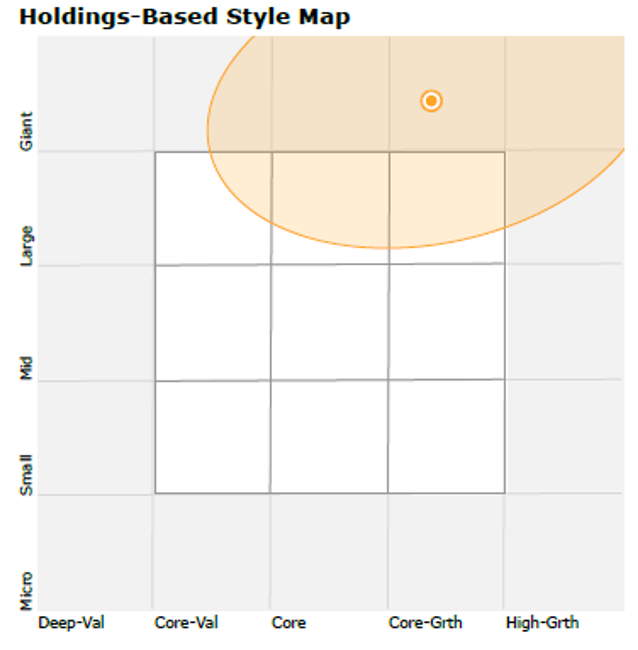
Chart 5: S&P 500 Index holdings based style map
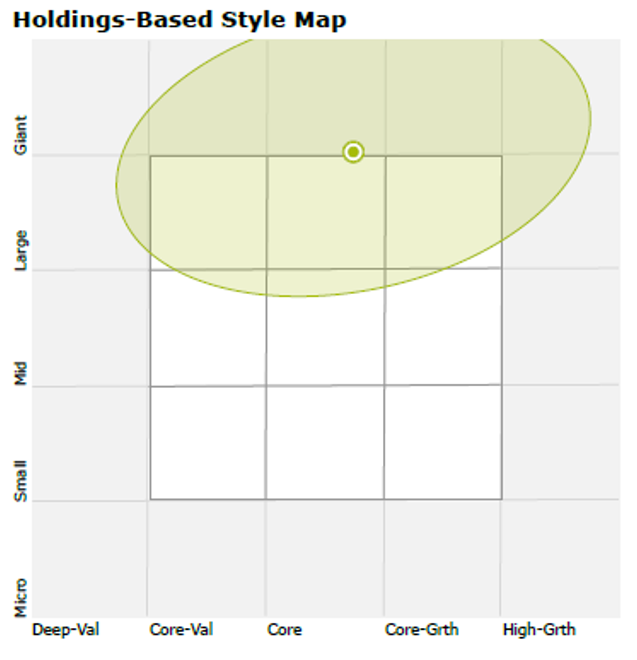
Chart 3,4 & 5 source: Morningstar Direct, as at 30 December 2023.
While each US equity index has its merit for portfolio inclusion, you should assess all the risks and consider your investment objectives.
Past performance is no guarantee of future performance. The above is not a recommendation. Please speak to your financial adviser or stock broker.
Learn more about ETF investing with VanEck Australia.
Key risks
An investment in MOAT carries risks associated with: financial markets generally, individual company management, industry sectors, ASX trading time differences, foreign currency, country or sector concentration, political, regulatory and tax risks, fund operations and tracking an index. See the PDS for details.
Note - There is no suggestion that Warren Buffett endorses the Morningstar Wide Moat Focus Index or MOAT ETF.


Published: 26 January 2023
Any views expressed are opinions of the author at the time of writing and is not a recommendation to act.
VanEck Investments Limited (ACN 146 596 116 AFSL 416755) (‘VanEck’) is the issuer and responsible entity of all VanEck exchange trades funds (Funds) listed on the ASX. This is general advice only and does not take into account any person’s financial objectives, situation or needs. The product disclosure statement (PDS) and the target market determination (TMD) for all Funds are available at vaneck.com.au. You should consider whether or not an investment in any Fund is appropriate for you. Investments in a Fund involve risks associated with financial markets. These risks vary depending on a Fund’s investment objective. Refer to the applicable PDS and TMD for more details on risks. Investment returns and capital are not guaranteed.
The Morningstar® Wide Moat Focus Index™ was created and is maintained by Morningstar, Inc. Morningstar, Inc. does not sponsor, endorse, issue, sell, or promote the Fund and bears no liability with respect to the Fund or any security. Morningstar®, Morningstar Wide Moat Focus Index™, and Economic Moat™ are trademarks of Morningstar, Inc. and have been licensed for use by VanEck.
Effective June 20, 2016, Morningstar implemented several changes to the Morningstar® Wide Moat Focus Index™ construction rules. Among other changes, the index increased its constituent count from 20 stocks to at least 40 stocks and modified its rebalance and reconstitution methodology. These changes may result in more diversified exposure, lower turnover and longer holding periods for index constituents than under the rules in effect prior to this date.