MOAT super selective passive approach
A more ‘active’ passive approach
Active management is picking stocks to outperform a market capitalisation benchmark index. Examples of market capitalisation benchmark indices include the S&P/ASX 200, the FTSE 100 and the S&P 500.
Passive management aims to perform in line with an index, though that index does not need to be a market capitalisation benchmark index.
The VanEck Morningstar Wide Moat ETF (MOAT) is a passive fund tracking the Morningstar Wide Moat Focus Index (MOAT Index). This index utilises innovations in index design with the aim of delivering above-market benchmark returns over the long term while retaining low costs. The market benchmark that the MOAT Index’s performance is compared is the broad-based US equities benchmark, the S&P 500 Index. By having its performance compared to a market benchmark index, MOAT is much like an active fund. Active managers compare their performance to a broad market index.
There are other ways MOAT is ‘active’.
For example, analysts at Morningstar scrutinise a universe of companies in the same way analysts of an active fund manager would.
Morningstar assigns each company it analyses an Economic Moat Rating of ‘wide’, ‘narrow’ or ’none’. Companies assigned a wide moat rating are those in which Morningstar has very high confidence that excess returns will remain for 10 years, with excess returns more likely than not to remain for at least 20 years. Companies with a narrow moat rating are those Morningstar believes are more likely than not to achieve normalised excess returns for at least the next 10 years. A firm with either no sustainable competitive advantage or one that Morningstar thinks will quickly dissipate is assigned a moat rating of ‘none’.
To be considered for the MOAT Index, a company must have been assigned a wide moat rating by Morningstar. But Morningstar, don’t stop there. Like an active manager, Morningstar is wary of overpaying for companies. In a way, the list of wide moat companies represents a ‘watch list.’
Morningstar also considers a company’s valuation to determine if the company will go into MOAT.
Morningstar’s forward-looking valuation approach allows long-term investors to look beyond a company’s current price and potential noise in the market. Each company is assigned a current fair value based on projected future cash flows, which is assessed against its current price.
The MOAT Index only includes the most attractively priced wide moat companies. This is assessed each quarter when the index is reconstituted at rebalance. In other words, MOAT buys companies that Morningstar considers relatively cheaper and sells companies that Morningstar considers too expensive, or they lose their wide-moat designation.
Active share
Perhaps the best way to demonstrate the active nature of MOAT is by looking at its ‘active share.’ Active share is a measure the fund management industry uses to quantify the amount by which a fund manager’s portfolio differs from its benchmark index.
If active management is picking stocks to outperform a benchmark index, as we noted above, an active manager can only add value relative to the index by deviating from it. The ability to pick the right stocks is the pretext for investors paying a higher management cost than they would pay an index fund manager who merely aims to track the benchmark. So, as an investor, you’d expect that as a starting point the active share for an active fund to be quite high.
But, you’d be wrong.
According to Morningstar1“at the end of 2020, large-growth’s 60% median active share ranked lowest of all domestic categories.” The same report highlighted the median active share for large blend and large value were between 70 and 80%. The Yale academics2who first proposed the metric suggested that funds with active shares below 60% should be avoided because they are ”closet indexers”3that charge high fees for providing index-like returns. It seems this may be the case for many US equity funds.
By way of contrast, MOAT has an active share score of 83.85% but with a lower fee.
MOAT is an innovative, super-selective approach to US equities.
So, let’s walk through the difference between the MOAT and the market capitalisation index for US equities, the S&P 500 Index.
MOAT vs S&P 500 Index – Fundamentals
Table 1: Statistics and fundamentals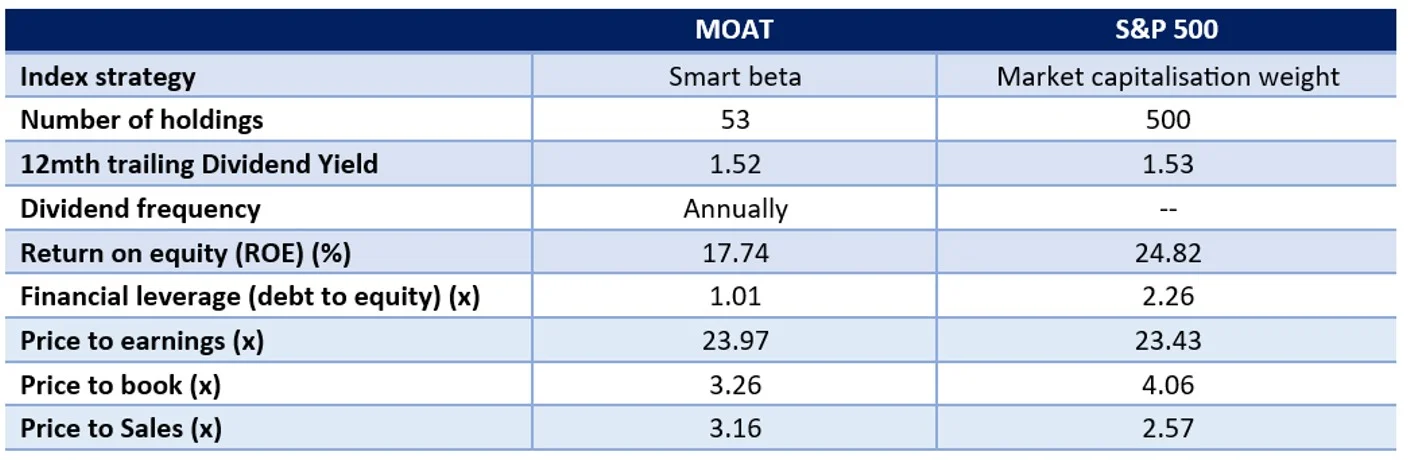
Source: FactSet, as at 30 June 2023. You cannot invest directly in an index. Past performance is not indicative of future performance.
As you would expect, MOAT has a lower debt to equity and is more attractive on a price-to-book value perspective.
MOAT vs S&P 500 Index - Performance
Moat investing has served Australian investors well. Across all periods, MOAT has outperformed the S&P 500 Index – testament to MOAT’s value and quality approach. As always past performance is not indicative of future performance.
Chart 1: Cumulative performance since MOAT ASX listing date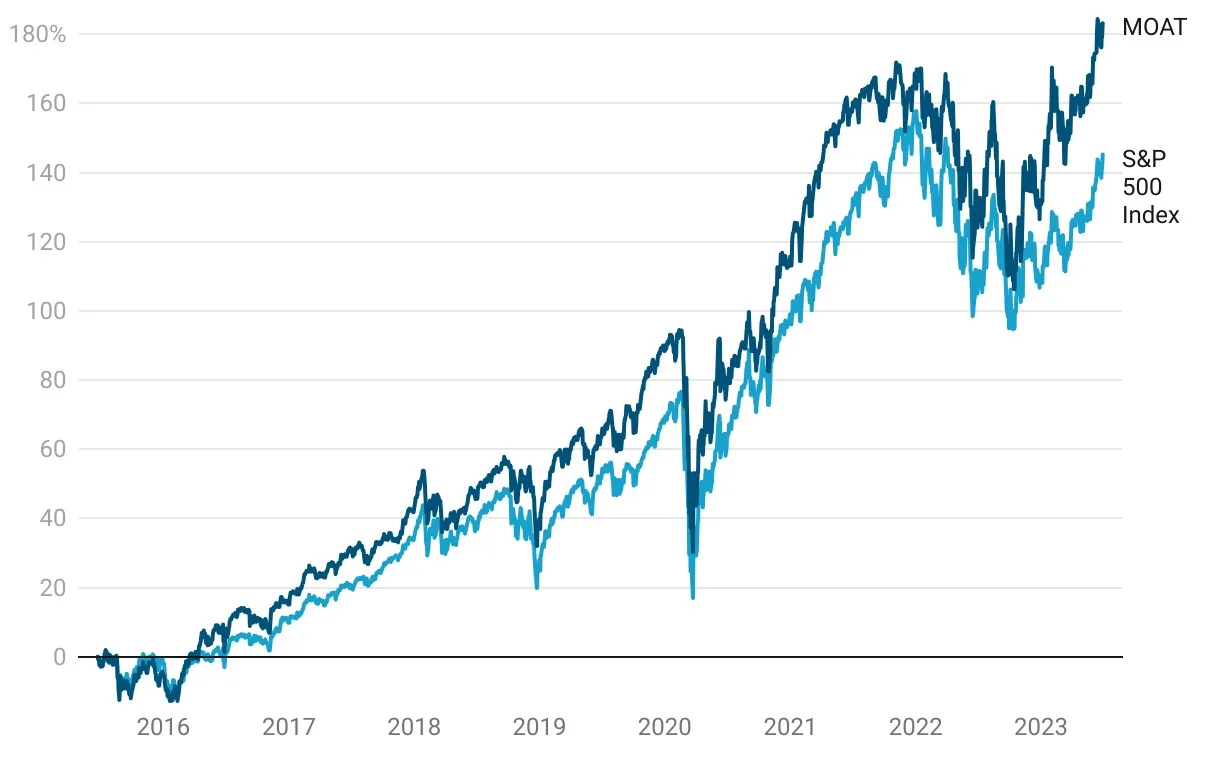
Table 2: Performance History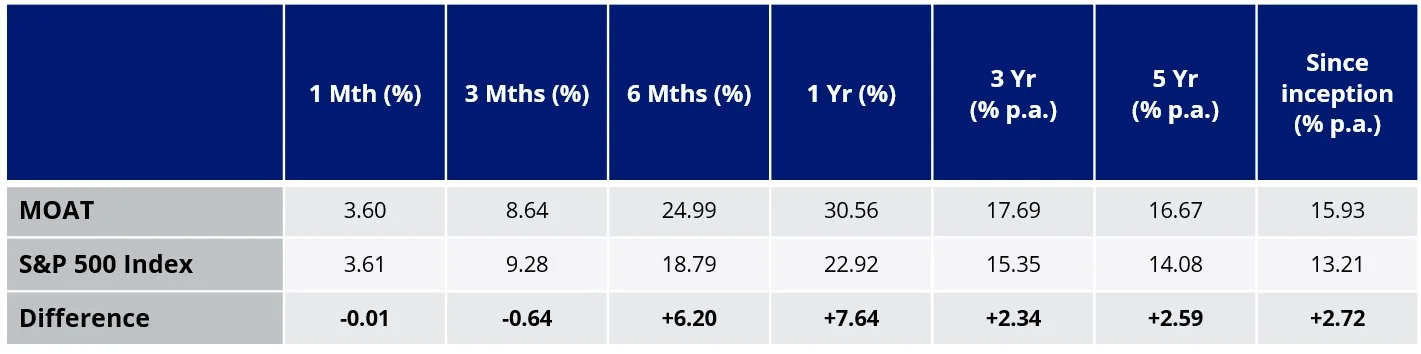
Chart 1 Source: Morningstar Direct. Table 2 Source: VanEck. The performance shown is from the ASX commencement of MOAT, 26 June 2015 to 30 June 2023. Index performance shown prior to its launch date is simulated based on the current Index methodology. Results are calculated to the last business day of the month and assume immediate reinvestment of distributions. ETF results are net of management fees and costs, but before brokerage fees or bid/ask spreads incurred when investors buy/sell on the ASX. Returns for periods longer than one year are annualised. Past performance is not a reliable indicator of current or future performance which may be lower or higher. Effective 20 June 2016, Morningstar implemented several changes to the Morningstar Wide Moat Focus Index construction rules. Among other changes, the index increased its constituent count from 20 stocks to at least 40 stocks and modified its rebalance and reconstitution methodology. These changes may result in more diversified exposure, lower turnover, and longer holding periods for index constituents than under the rules in effect prior to 20 June 2016. The S&P 500 is shown for comparison purposes as it is the widely recognised benchmark used to measure the performance of the broad US equities market. It includes the 500 largest US listed companies, weighted by market capitalisation. MOAT’s index measures the performance of 40 to 80 US companies with a Morningstar Economic Moat Rating™ of “Wide”. MOAT’s index has fewer securities and different industry allocations than the S&P 500.
MOAT vs S&P 500 Index - Top 10 holdings
It has been well documented that the top 10 of the S&P 500 Index have been the drivers of much of the growth of that index. This has led to some unintended concentration within that index, as well as valuation concerns.
Below you can see the top 10 companies. Despite having a tenth of the number of holdings, MOAT’s top 10 make up less than the top 10 of a portfolio of 500 companies. This means that many of the small companies in the S&P 500 do not contribute much to portfolio performance – to see all the holdings in MOAT and their weightings click here. 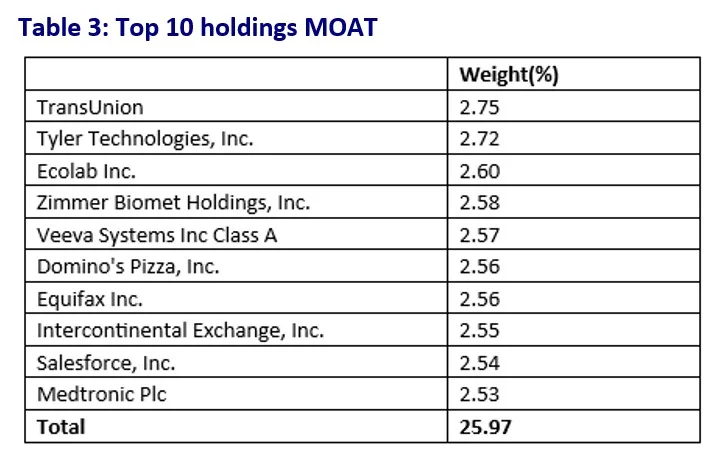
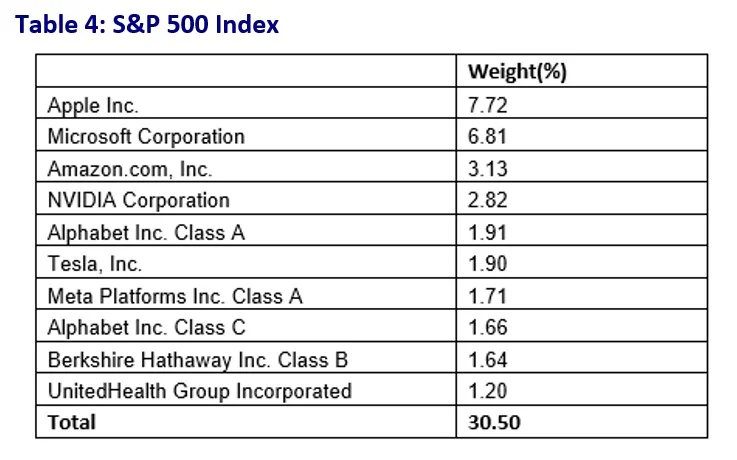
Table 3 & 4 source: VanEck, S&P FactSet, as at 30 June 2023.
MOAT vs S&P 500 Index - Style
When looking at portfolios it is important to determine what style e.g. value or growth and what size bias a portfolio holds e.g. giant, large, mid or small. Below we can see MOAT’s. Importantly MOAT holds large companies with a similar growth orientation relative to the S&P 500 index.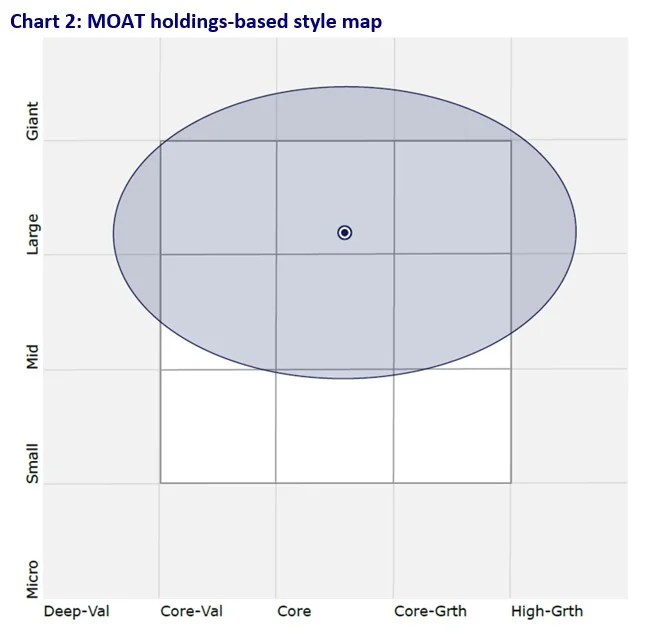
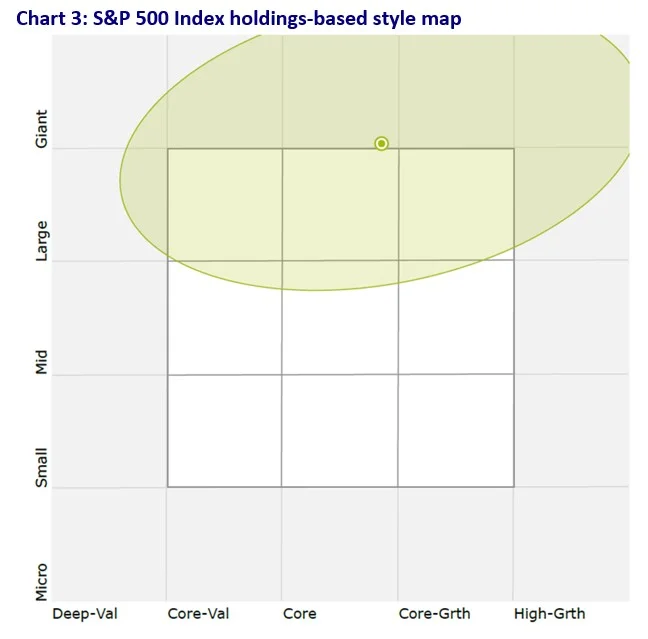
Chart 2 & 3 source: Morningstar Direct, as at 30 June 2023
While each US equity index has its merit for portfolio inclusion, you should assess all the risks and consider your investment objectives.
Past performance is no guarantee of future performance. The above is not a recommendation. Please speak to your financial adviser or stock broker.
For further information you can contact us at +61 2 8038 3300.


Published: 20 July 2023
1Morningstar Research, 2021, Unattractive share, November 2021
2Cremers, K. J. Martijn and Petajisto, 2009, How Active is Your Fund Manager? A New Measure That Predicts Performance (March 31, 2009).
3p 3329
Key risks
An investment in MOAT carries risks associated with: financial markets generally, individual company management, industry sectors, ASX trading time differences, foreign currency, country or sector concentration, political, regulatory and tax risks, fund operations and tracking an index. See the PDS for details.
Any views expressed are opinions of the author at the time of writing and is not a recommendation to act.
VanEck Investments Limited (ACN 146 596 116 AFSL 416755) (‘VanEck’) is the issuer and responsible entity of all VanEck exchange traded funds (Funds) listed on the ASX. This is general advice only and does not take into account any person’s financial objectives, situation or needs. The product disclosure statement (PDS) and the target market determination (TMD) for all Funds are available at vaneck.com.au. You should consider whether or not an investment in any Fund is appropriate for you. Investments in a Fund involve risks associated with financial markets. These risks vary depending on a Fund’s investment objective. Refer to the applicable PDS and TMD for more details on risks. Investment returns and capital are not guaranteed.
The Morningstar® Wide Moat Focus Index™ was created and is maintained by Morningstar, Inc. Morningstar, Inc. does not sponsor, endorse, issue, sell, or promote the Fund and bears no liability with respect to the Fund or any security. Morningstar®, Morningstar Wide Moat Focus Index™, and Economic Moat™ are trademarks of Morningstar, Inc. and have been licensed for use by VanEck.
Effective June 20, 2016, Morningstar implemented several changes to the Morningstar® Wide Moat Focus Index™ construction rules. Among other changes, the index increased its constituent count from 20 stocks to at least 40 stocks and modified its rebalance and reconstitution methodology. These changes may result in more diversified exposure, lower turnover and longer holding periods for index constituents than under the rules in effect prior to this date.