MOAT companies fortify in 2023
Over 2023 the VanEck Morningstar Wide Moat ETF (MOAT) beat the S&P500 Index, surging 30.68% compared to the index’s 24.89% gain. This outperformance is particularly notable, as it came amid a top-heavy market where the mega-cap ‘Magnificent Seven’ was responsible for much of the market’s overall gains and MOAT did not have significant exposure to these. Moats once again have shown their worth.
An ‘active’ passive approach
The investment philosophy that underlies the VanEck Morningstar Wide Moat ETF (MOAT) is based on the concept of economic ‘moats’ that was popularised by Warren Buffett. Buffett is quoted as saying, "In business, I look for economic castles protected by unbreachable 'moats'."
Morningstar has turned a well-known investment philosophy and approach into an actionable investment strategy. Morningstar assigns each company it analyses an Economic Moat Rating of ‘wide’, ‘narrow’ or ’none’. Companies assigned a wide moat rating are those in which Morningstar has very high confidence that excess returns will remain for 10 years, with excess returns more likely than not to remain for at least 20 years. Companies with a narrow moat rating are those Morningstar believes are more likely than not to achieve normalised excess returns for at least the next 10 years. A firm with either no sustainable competitive advantage or one that Morningstar thinks will quickly dissipate is assigned a moat rating of ‘none’.
Morningstar’s equity analysts don’t stop there. Value is also an important consideration for investors wary of overpaying for companies, so Morningstar also calculates a ‘fair value’ to each company in its coverage universe. Fair value is a per-share measure of what Morningstar thinks the business is worth. Morningstar uses its proprietary three-stage discounted cash flow model combined with a variety of supplementary fundamental methods such as sum-of-the-parts, multiples and yields to calculate what they think a company is worth and this is assessed against its current price.
Using a combination of the qualitative moat data and the quantitative fair value data, Morningstar constructs its Moat Index series.
MOAT tracks the Morningstar® Wide Moat Focus Index™ (MOAT Index), a rules-based, equal-weighted index intended to offer exposure to attractively priced companies with sustainable competitive advantages according to Morningstar’s equity research team.
MOAT is an innovative, super-selective approach to US equities. Importantly it is passive, so therefore it enjoys the low costs associated with passive ETFs. It is a part of the ETF ecosystem referred to as ‘smart beta’. Smart beta aims to provide investors with active outcomes relative to traditional market capitalisation indices, like active managers, but retaining the low costs of ETFs.
So, let’s walk through the difference between MOAT and the market capitalisation index for US equities, the S&P 500 Index.
MOAT vs S&P 500 Index – Fundamentals
Table 1: Statistics and fundamentals
|
MOAT |
S&P 500 |
|
|
Index strategy |
Smart beta |
Market capitalisation weight |
|
Number of holdings |
49 |
500 |
|
12-month trailing dividend yield (%) |
1.69 |
1.46 |
|
Dividend frequency |
Annually |
|
|
ROE |
16.52 |
23.69 |
|
Financial leverage |
0.83 |
2.59 |
|
Price to earnings |
25.3 |
24.1 |
|
Price to book |
3.01 |
4.23 |
|
Price to sales |
3.01 |
2.71 |
Source: FactSet, as at 31 December 2023. You cannot invest directly in an index.
As you would expect, MOAT has a lower financial leverage and is more attractive from a price-to-book value perspective.
MOAT vs S&P500 Index - Performance
Moat investing has served Australian investors well. Across all periods, MOAT has outperformed the S&P 500 Index – testament to MOAT’s approach. As always, we caution that past performance is not indicative of future performance.
Chart 1: Cumulative performance since MOAT ASX listing date 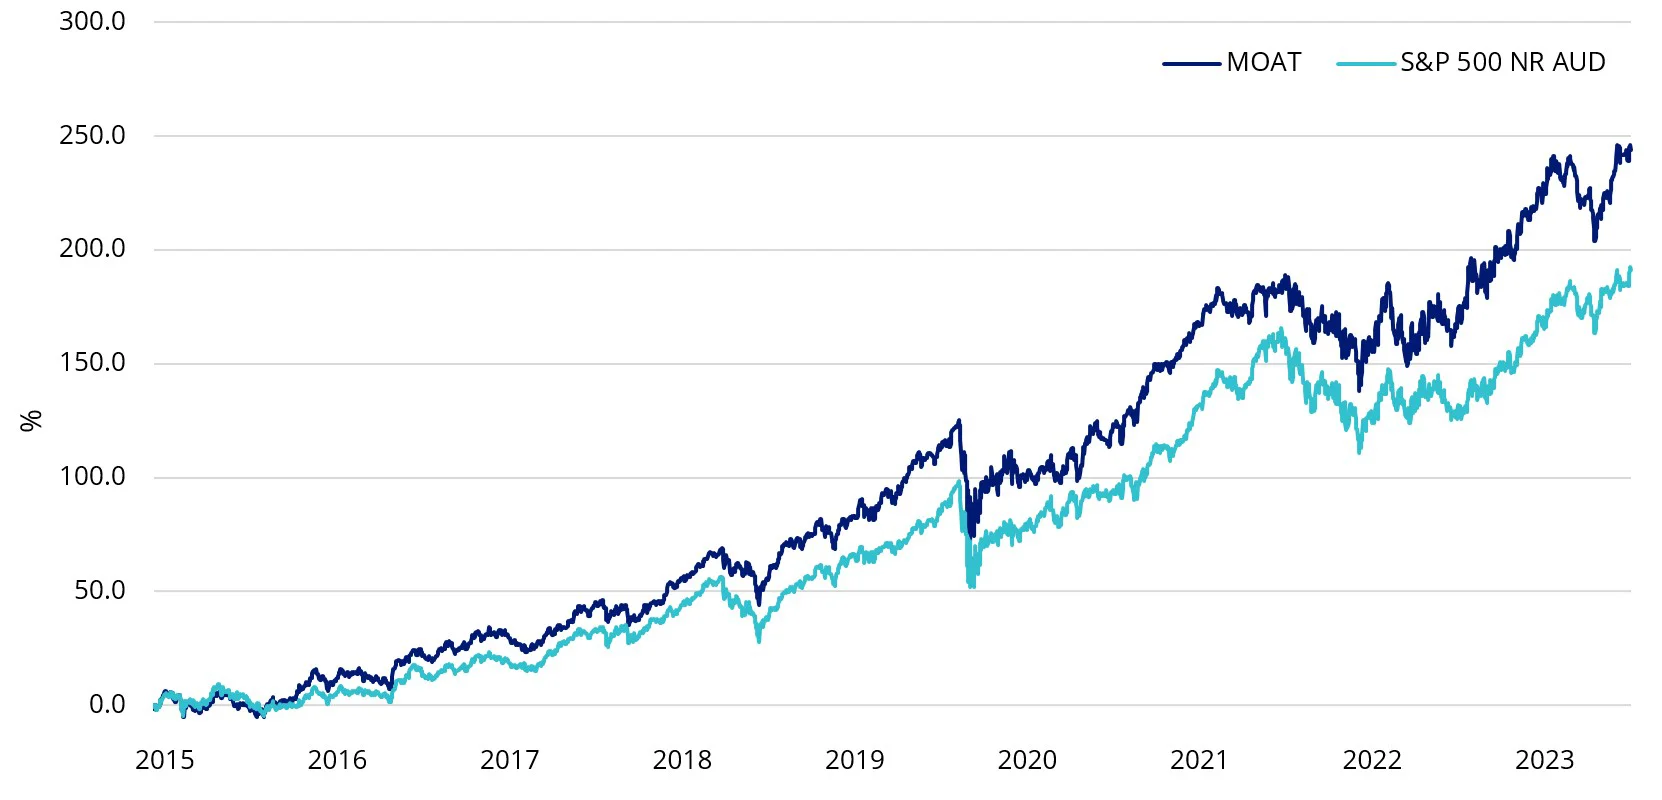
Table 2: Trailing performance
|
1 month (%) |
3 months (%) |
1 yr (%) |
3 yrs |
5 yrs |
7 yrs |
Since Inception |
|
|
MOAT |
4.74 |
6.68 |
30.68 |
16.76 |
17.50 |
15.84 |
15.52 |
|
S&P 500 Index |
1.55 |
5.51 |
24.89 |
14.08 |
15.82 |
13.78 |
13.07 |
|
Difference |
+3.19 |
+1.17 |
+5.79 |
+2.68 |
+1.68 |
+2.06 |
+2.45 |
*ASX Inception date is 26 June 2015. Chart 1 and Table 2 Source: Morningstar Direct, VanEck as at 31 December 2023. The chart and table above show the past performance of MOAT and of the S&P500 Index. You cannot invest directly in an index. Results are calculated to the last business day of the month and assume immediate reinvestment of distributions. MOAT results are net of management fees and other costs incurred in the fund, but before brokerage fees and bid/ask spreads incurred when investors buy/sell on the ASX. Returns for periods longer than one year are annualised. Past performance is not a reliable indicator of future performance. The S&P 500 is shown for comparison purposes as it is the widely recognised benchmark used to measure the performance of the broad US equities market. It includes the 500 largest US listed companies, weighted by market capitalisation. MOAT’s index measures the performance of 40 to 80 US companies with a Morningstar Economic Moat Rating™ of “Wide”. MOAT’s index has fewer securities and different industry allocations than the S&P 500. Click here for more details.
MOAT vs S&P 500 Index - Top 10 holdings
It has been well documented that the top 10 of the S&P 500 Index have been the drivers of much of the growth of that index. This has led to some unintended concentration within that index, as well as valuation concerns. The S&P 500 is now almost one-third information technology companies.
Below you can see the top 10 companies. Despite having a tenth of the number of holdings, MOAT’s top 10 make up less than the top 10 of a portfolio of 500 companies. This means that many of the small companies in the S&P 500 do not contribute much to portfolio performance. From a sector perspective, MOAT is underweight information technology and overweight industrials and health care. To see all the holdings in MOAT and their weightings click here.
Table 3: Top 10 holdings
|
MOAT |
Weight % |
S&P 500 Index |
Weight % |
|
Allegion Public Limited Company |
2.79 |
Apple Inc. |
7.03 |
|
MarketAxess Holdings Inc. |
2.74 |
Microsoft Corporation |
6.98 |
|
Equifax Inc. |
2.72 |
Amazon.com, Inc. |
3.45 |
|
U.S. Bancorp |
2.72 |
NVIDIA Corporation |
3.06 |
|
Teradyne, Inc. |
2.70 |
Alphabet Inc. Class A |
2.06 |
|
Keysight Technologies Inc |
2.67 |
Meta Platforms Inc. Class A |
1.96 |
|
Etsy, Inc. |
2.66 |
Alphabet Inc. Class C |
1.75 |
|
Salesforce, Inc. |
2.65 |
Tesla, Inc. |
1.72 |
|
Charles Schwab Corp |
2.65 |
Berkshire Hathaway Inc. Class B |
1.62 |
|
Agilent Technologies, Inc. |
2.63 |
JPMorgan Chase & Co. |
1.23 |
Source: VanEck, S&P FactSet, as at 31 December 2023.
Chart 2: Sector breakdown MOAT and S&P 500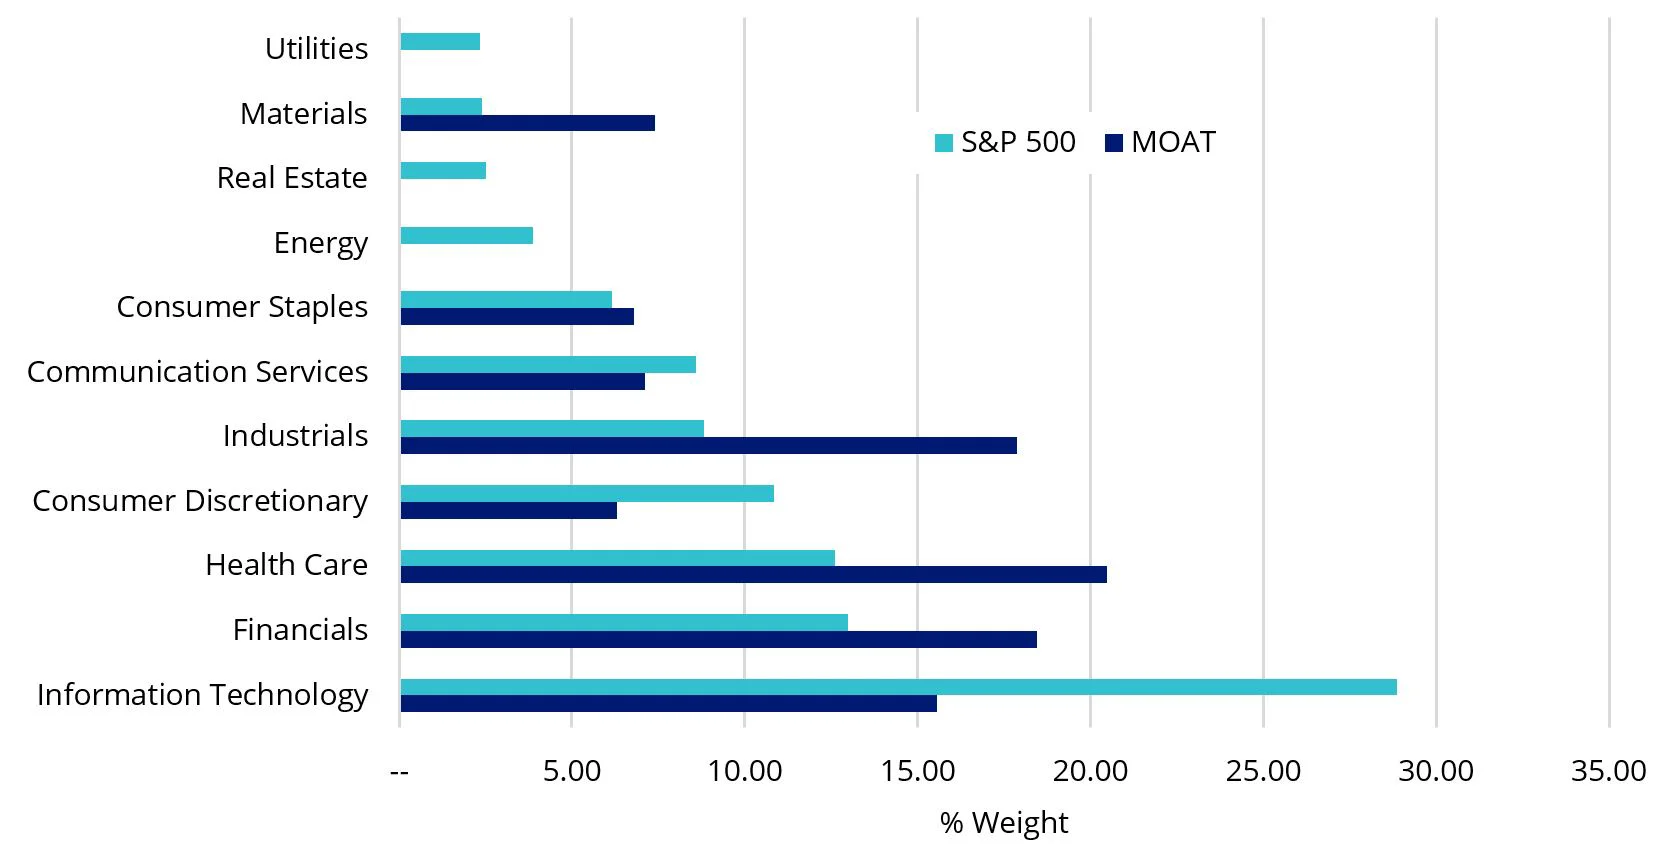
Source: VanEck, S&P FactSet, as at 31 December 2023
While different investment approaches for US equities have merit for portfolio inclusion, you should assess all the risks and consider your investment objectives.
Past performance is no guarantee of future performance. The above is not a recommendation. Please speak to your financial adviser or stock broker.
For further information, you can contact us at +61 2 8038 3300.
Key risks: An investment in MOAT carries risks associated with: financial markets generally, individual company management, industry sectors, ASX trading time differences, foreign currency, country or sector concentration, political, regulatory and tax risks, fund operations and tracking an index. See the PDS for details.


Published: 18 January 2024
1There is no suggestion that Warren Buffett endorses the Morningstar Wide Moat Focus Index or MOAT ETF.
Any views expressed are opinions of the author at the time of writing and is not a recommendation to act.
VanEck Investments Limited (ACN 146 596 116 AFSL 416755) (VanEck) is the issuer and responsible entity of all VanEck exchange traded funds (Funds) trading on the ASX. This is general advice only and does not take into account any person’s financial objectives, situation or needs. The product disclosure statement (PDS) and the target market determination (TMD) for all Funds are available at vaneck.com.au. You should consider whether or not an investment in any Fund is appropriate for you. Investments in a Fund involve risks associated with financial markets. These risks vary depending on a Fund’s investment objective. Refer to the applicable PDS and TMD for more details on risks. Investment returns and capital are not guaranteed.
The Morningstar® Wide Moat Focus Index™ was created and is maintained by Morningstar, Inc. Morningstar, Inc. does not sponsor, endorse, issue, sell, or promote the Fund and bears no liability with respect to the Fund or any security. Morningstar®, Morningstar Wide Moat Focus Index™, and Economic Moat™ are trademarks of Morningstar, Inc. and have been licensed for use by VanEck.
Effective June 20, 2016, Morningstar implemented several changes to the Morningstar® Wide Moat Focus Index™ construction rules. Among other changes, the index increased its constituent count from 20 stocks to at least 40 stocks and modified its rebalance and reconstitution methodology. These changes may result in more diversified exposure, lower turnover and longer holding periods for index constituents than under the rules in effect prior to this date.