Let's start at the very beginning
It’s a very good place to start. In Greek, when you read, you begin with alpha, beta and gamma. When you invest, you begin with beta.
Make sure your beta is right because it affects your investment outcome.
Since the rise of ETFs (Exchange Traded Funds), there has been a focus on fees. The first casualties were active managers who started to see their market share being eroded by these low-cost, transparent funds. Many active managers dropped their fees.
As ETFs gained traction, more asset management businesses started offering more ETFs. Often the differences in these ETFs are difficult to ascertain. Sometimes these differences appear to be just the fees, but it’s important to check if the indices are different, too. It’s also worth considering the asset manager offering the ETF.
Fees are easy to understand. This is seen as the price of the ETF. In the consumer world, the price of a good is seen by consumers as a signal of quality, and while the most expensive is not always the best quality, the cheapest rarely is.
Investments, like consumer goods, should be assessed on the outcome they offer, therefore it is useful for investors to understand different indices and the ETF manager because they can impact the investment outcome.
So, let’s unpack indices first.
Indices: Beta
In financial jargon, beta is the term used for the market benchmark. In Australia, the S&P/ASX 200 Index is the market ‘beta’. There are ETFs that track market beta indices for a range of asset classes including Australian equities, international equities, bonds and infrastructure.
Beta is the starting point, and asset owners who allocate to beta expect to get exactly that, ‘true’ beta.
However, some funds track indices that appear to be like the market beta but are not. Often the ETFs that track these indices are a cheaper alternative than the ETFs that track the market beta. When you use these beta-like indices, your outcome will be distorted and because of compounding, you could have a butterfly effect.
The historic basis for the ‘true’ market beta, is derived from Modern Portfolio Theory (MPT) and its underlying principles that have been used by industry professionals for decades to help investors understand risks and returns.
A simple example would be two Australian equity indices, the S&P/ASX 200 index (the ‘true’ beta) and another index provider’s Australia 200 (beta-like). In this instance, over the past five years, the ‘true’ beta has underperformed the copy-cat index. While, on the surface, this could be a great outcome, the reality is it is also a risk.
The subtle differences in the index could easily mean that performance could go the other way. To give you an idea of how different the returns can be on any given day, the below chart shows the excess returns of the copy index each day.
Chart 1: Five-year daily excess returns: Australian equity betas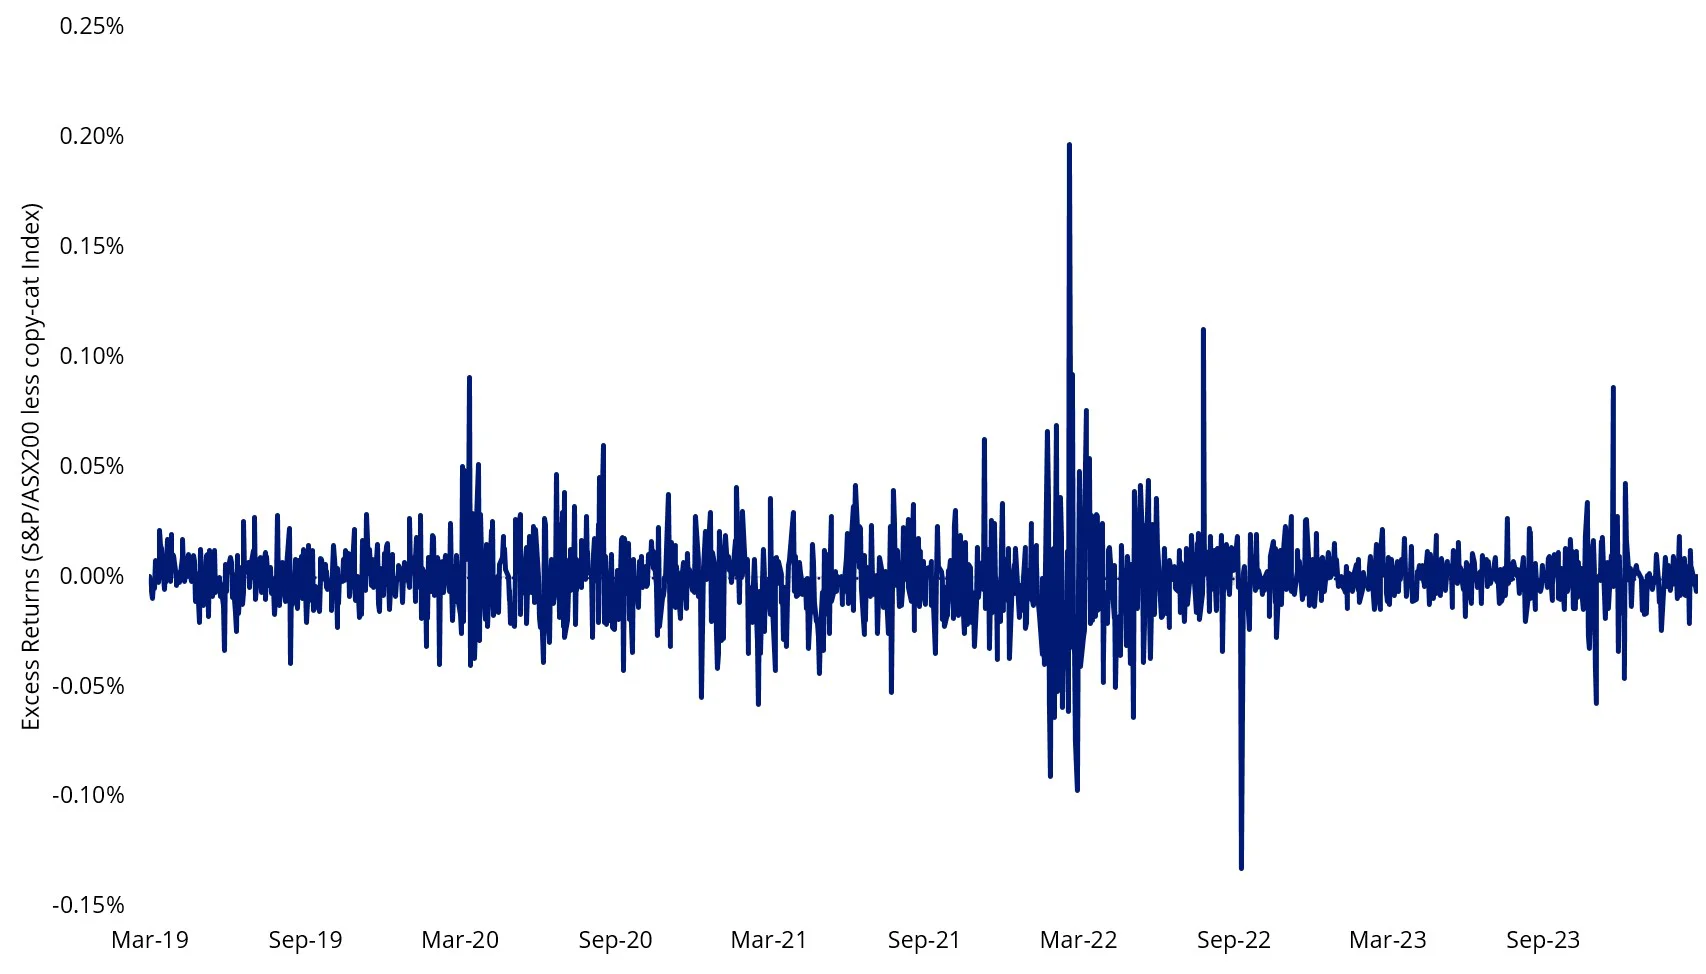
Source: VanEck, Bloomberg. You cannot invest in an index. Past performance is not a reliable indicator of future performance.
There is an example in which performance has gone the other way. For Australian investors, the ‘true’ beta for international equities is the MSCI World ex Australia Index. Over the past five years, a similar copycat index has underperformed the true beta. And like chart 1 above, its variation to the ‘beta’ on any day could be wildly different from the true beta.
Chart 2: Five-year daily excess returns: International equity betas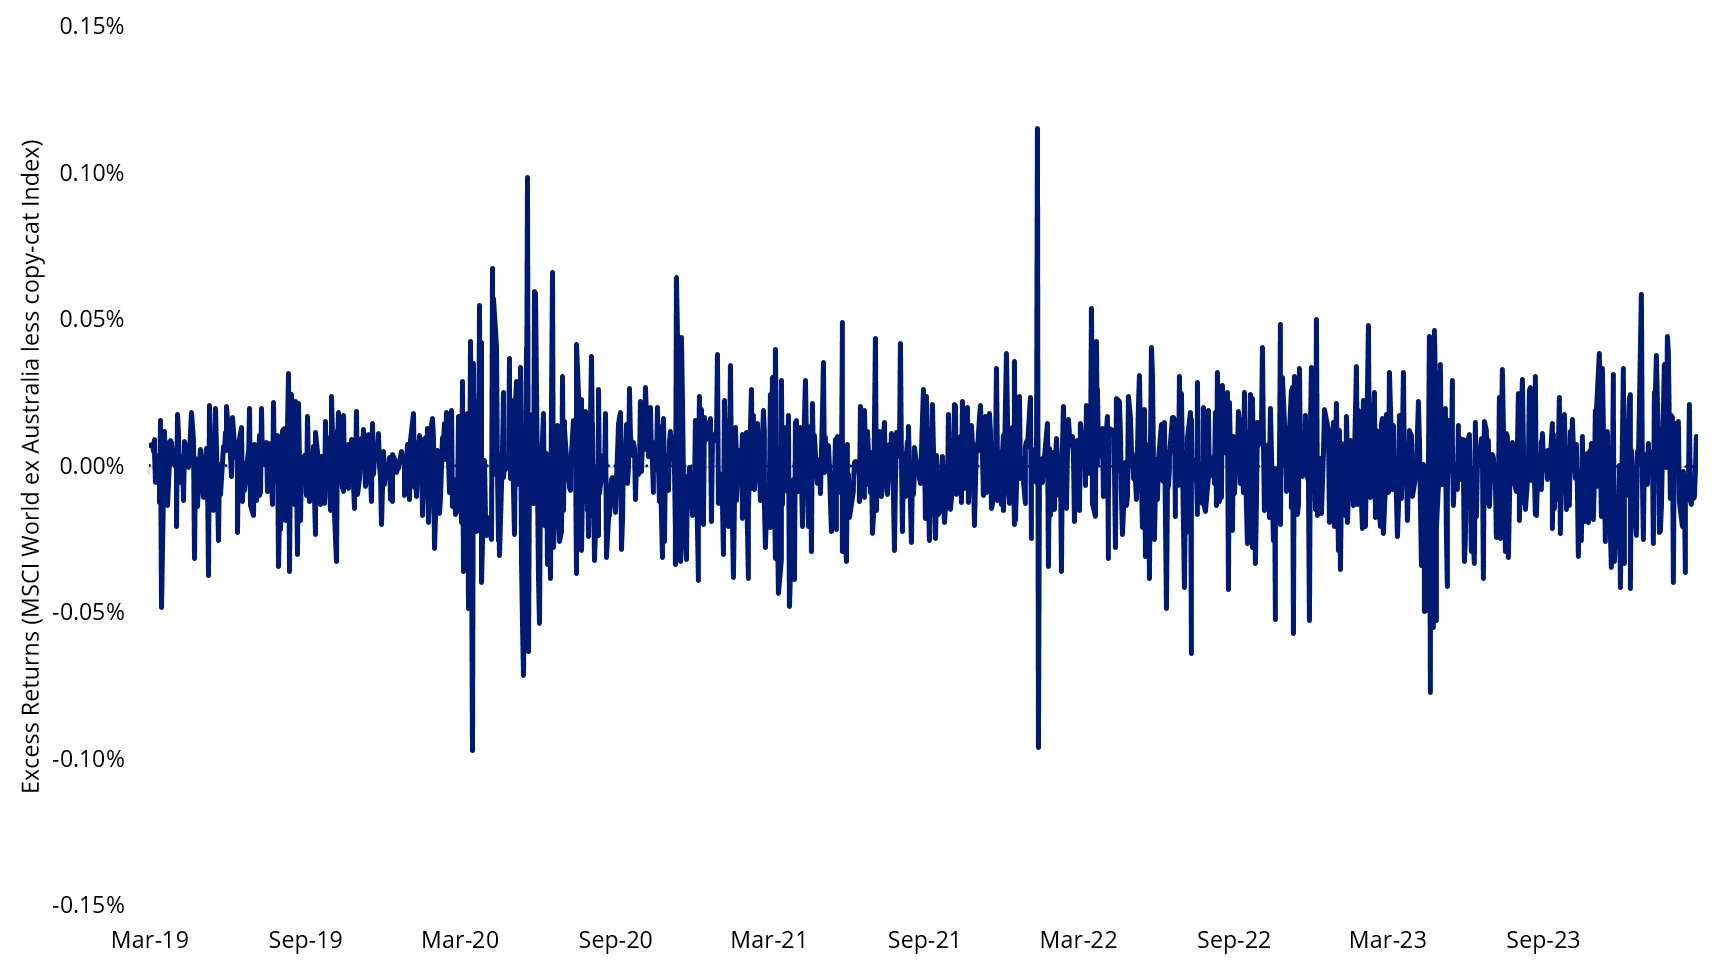
Source: VanEck, Bloomberg. You cannot invest in an index. Past performance is not a reliable indicator of future performance.
For investors who are aiming to achieve market returns, beware of the copycat indices. It is a risk for which you should be aware.
Remember, when you invest for market returns you should be getting ‘true’ index returns (minus fees) without the fear of additional risks. You should be able to construct the rest of your portfolio confident in the level of risk in your equity bucket. A different beta will be exactly that, different.
Indices (continued): The misfits
So, we have ‘true’ beta being the market capitalisation indices that have become the standard measure for the market return and we have beta-like indices which are copy-cats of these, there is another type of index to understand and that is ‘smart beta’. Smart beta is any index construction methodology that is different from market capitalisation. An example of a smart beta index is the MSCI World ex Australia Quality Index, which focuses on the world’s highest-quality companies based on key fundamentals.
Again though, the beginning or starting point, or the ‘true’ beta is a crucial first step in the process of offering an investment product that tracks a smart beta index.
Investors that start with the wrong benchmark may create a divergence and thus not achieve true exposure to the investment outcome they are targeting. According to a research paper from MSCI, Benchmark Misfit Risk: Identifying the Risk Contribution Arising from Differences in Manager and Policy Benchmarks, this discrepancy between the manager’s beta and the wrong starting point is known as benchmark misfit.
From an investor’s point of view, ‘benchmark misfit’ introduces two basic investment problems. First, it creates inconsistency in risk reporting. Many risks are relative to the benchmark index, or beta. From a different starting point, the risk and return attributes may capture new and different idiosyncrasies. Second, it introduces uncertainty in how and where the actual risk budget is being spent. Performance and risk are likely to be more idiosyncratic, thus harder to explain or match the expectation.
The returns of these copycat smart beta ‘misfits’ may differ from your intended investment outcome.
Again, the cheapest may not always be the best.
The asset manager: skill
There are two important ways the asset manager offering the ETF can impact the investment outcome, their skill and their income management.
In regards to skill, the goal of an ETF is to track the performance of its index. It is important to investigate how good the ETF issuer is at tracking its index when adjusted for the fees associated with the ETF which are not incurred by the index.
The difference in performance should usually be small, in the range of one per cent. However, various factors can sometimes conspire to open a gap of several percentage points. To avoid such an unwelcome surprise, investors should seek ETF issuers that have a history of tracking their respective indices closely, which means tracking within just a few basis points of the index after adjusting for fees.
You would expect an ETF issuer to report this information on their website. Performance tables should include the performance of the ETF and the performance of the index they are tracking. If they don’t, alarm bells should ring.
The asset manager: income (if it’s important to you)
For many ETF investors, income is an important investment outcome they are aiming to achieve. Here are two good examples that we think may help investors consider assessing the different income outcomes between similar ETFs.
First, above we spoke about two different Australian equity indices, the S&P/ASX 200 and a copy-cat 200 index. ETFs track both of these indices and while you would expect the income outcome would be similar, it is not. VanEck’s analysis found that the dividend yield for the ETF that tracked the S&P/ASX 200 was 0.30% higher than the copy-cat ETF (as of 31 December 2023). Furthermore, the franking credits received by investors were different too.
The differences in income may be explained by the slight differences in the indices, but there are instances of ETFs tracking the same index in which the income outcome is different. In the second example, we have two ETF managers tracking the same index, but the income outcome is very different.
Infrastructure is an income-yielding asset class. A large share of its returns is traditionally income, not capital growth and its investors would expect this income to be smooth and dependable. VanEck and one of its peers track the same market beta for infrastructure, yet over the comparable period, being three quarters, there is a significant difference in the income experience. Only one fund has paid smooth income payments.
Table 1: Cents per unit distributions
|
Date |
IFRA |
Infrastructure ETF A |
|
30/06/2023 |
17.000000 |
10.720008 |
|
30/09/2023 |
17.000000 |
17.485912 |
|
31/12/2023 |
17.000000 |
11.541648 |
Source: VanEck, ASX
Because investing in overseas markets and hedging returns back to Australian dollars can be difficult, a thorough understanding of the capital markets and tax rules means that the choice of asset manager could be paramount, especially if you seek an income-oriented investment outcome. Make sure the composition of the returns reflects your expectations.
Other ways to assess the ETF asset manager is to understand their history, how long they have been investing money and how long they have been issuing ETFs, including both here and overseas. Try to appreciate their commitment to investors and assess the quality of their product suite.
So, only now after assessing different indices, investment outcomes and the investment manager are we ready to talk about fees.
Let’s talk about fees
There is no doubt that fees are an important consideration for investors. But it is secondary to an investment outcome.
We think savvy Australian investors care more about their investment outcome than they do fees so will recognise poor quality where they see it.
Investors don’t want to overpay, likewise, the cheapest may not achieve the outcome they desire.
As always, we would recommend you speak to a financial adviser or broker to determine which Australian equity investment is right for you. Their advice, we would argue, can also be value for money.
Key risks
An investment in the funds carries risks associated with: financial markets generally, individual company management, industry sectors, ASX trading time differences, foreign currency, sector concentration, political, regulatory and tax risks, fund operations, liquidity and tracking an index. See the PDS for details.


Published: 08 March 2024
Any views expressed are opinions of the author at the time of writing and is not a recommendation to act.
VanEck Investments Limited (ACN 146 596 116 AFSL 416755) (VanEck) is the issuer and responsible entity of all VanEck exchange traded funds (Funds) trading on the ASX. This is general advice only and does not take into account any person’s financial objectives, situation or needs. The product disclosure statement (PDS) and the target market determination (TMD) for all Funds are available at vaneck.com.au. You should consider whether or not an investment in any Fund is appropriate for you. Investments in a Fund involve risks associated with financial markets. These risks vary depending on a Fund’s investment objective. Refer to the applicable PDS and TMD for more details on risks. Investment returns and capital are not guaranteed.