Dispelling the value myth
It is a commonly cited myth that value, as an investment style, has underperformed growth during the current long-lasting US share market rally.
Growth has indeed rallied; this part is true. Inflows into growth stocks have powered the US equity market ahead. But not all value approaches have been underperforming.
So-called ‘value’ companies that enjoy identifiable competitive advantages have outperformed the S&P 500 in recent years.
Growth stocks have powered the US stock market ahead over the past decade. The chart below shows that during this time, value stocks have underperformed growth stocks.
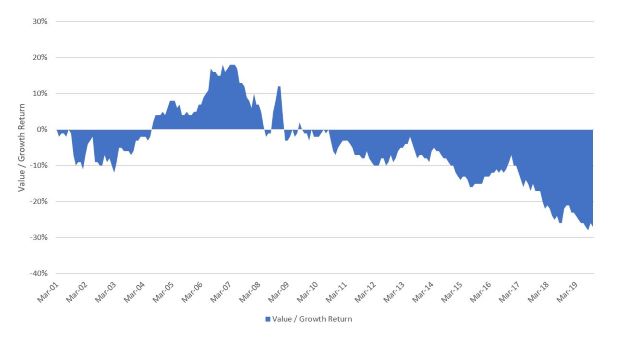
Source: Bloomberg. Indices used S&P 500 Value Index and S&P 500 Growth Index, as at 31 October 2019. Past performance is not a reliable indicator of future performance.
It is evident value has underperformed and thus you would expect most so-called ‘value’ strategies to have also underperformed the S&P 500 index. Most have, it is true – but not all.VanEck Vectors Morningstar® Wide Moat ETF (MOAT) has outperformed since its launch in 2012. This year it has rallied, spurred on by value stocks that enjoy sustainable competitive advantages as identified by Morningstar. MOAT has outperformed the S&P 500 over one, three, and five years and since inception.
What’s driving the performance?
The key to MOAT’s consistent outperformance lies in investing in value companies only with a sustainable competitive advantage. MOAT tracks the Morningstar® Wide Moat Focus NR AUD Index™ which restricts investments to attractively priced companies that possess a ‘wide’ economic moat as determined by Morningstar’s equity research. These companies boast structural competitive advantages and high barriers to entry which Morningstar believes allow a company to generate returns on invested capital in excess of weighted average cost of capital for at least 20 years. The index targets companies trading at attractive prices relative to Morningstar's estimate of fair value.This year, MOAT’s outperformance has been notable, returning 29.63% to 31 October, compared to 25.85% for the S&P 500, as the table below shows.
Table 1 - MOAT Index performance to 31 October 2019
|
|
1 mth |
3 mth |
6 mth |
YTD |
1 Year |
3 Years |
5 Years |
7 Years |
Since Inception |
|
MOAT ETF |
1.92 |
5.50 |
9.33 |
29.63 |
24.15 |
21.79 |
17.92 |
22.19 |
21.17 |
|
S&P 500 |
0.02 |
2.47 |
6.41 |
25.85 |
17.61 |
18.79 |
16.31 |
20.76 |
19.74 |
|
OUTPERFORMANCE |
+1.90 |
+3.03 |
+2.92 |
+3.78 |
+6.54 |
+3.00 |
+1.61 |
+1.43 |
+1.43 |
Inception date is 25 April 2019. Source: VanEck, Morningstar Direct as at 31 October 2019. Performance is in Australian dollars. Results are calculated to the last business day of the month and assume immediate reinvestment of all dividends. MOAT performance includes management fees and other costs incurred in the fund but excludes broker fees and buy/sell spreads associated with investing in MOAT. Past performance is not a reliable indicator of future performance of the index or MOAT.
Key to MOAT’s consistent outperformance lies in getting valuations right and not overpaying for stocks which are market leaders.
Morningstar’s equity research team adopts a forward-looking approach that includes forecasting a company’s future free cash flows to determine its current fair value estimate. The index identifies moat companies that appear the most attractively priced. The assumption is that the market will realise the intrinsic value of these companies and bring their market price more in line with Morningstar’s view of fair value.
This belief has been borne out by MOAT’s strong performance.
Riding the rally
The late stage rally in US stocks this year could continue over the coming weeks with a reasonably high likelihood of a traditional ‘Christmas rally’ given resurging US stock prices, indicated by the strong payroll numbers for October. This has set the US market up nicely for a Santa Clause rally, which traditionally runs from late November through to the first two weeks of January. Investors who buy into MOAT now could enjoy this rally.
Factors contributing to a positive outlook heading into 2020 include optimism that the US and China will reach an agreement on a trade deal in December. Further support could come from interest rates cuts from the US Federal Reserve which would favour US equity valuations. Global growth fears have subsided in recent weeks, adding to investors’ confidence and stock market returns.
Learn more about MOAT via our dedicated resource US equity: wide moat investing.
IMPORTANT NOTICE:
All returns in Australian dollars unless otherwise indicated.
This information is issued by VanEck Investments Limited ABN 22 146 596 116 AFSL 416755 (‘VanEck’) is the issuer of the VanEck Vectors Morningstar Wide Moat ETF (‘Fund’). Nothing in this content is a solicitation to buy or an offer to sell shares of any investment in any jurisdiction including where the offer or solicitation would be unlawful under the securities laws of such jurisdiction. This information contains general advice only about financial products and is not personal advice. It is intended for use by financial services professionals only. It does not take into account any person’s individual objectives, financial situation or needs. Before making an investment decision in relation to the fund, you should read the applicable PDS available at www.vaneck.com.au or by calling 1300 68 38 37and with the assistance of a financial adviser consider if it is appropriate for your circumstances. The Fund is subject to investment risk, including possible loss of capital invested. Past performance is not a reliable indicator of future performance. No member of the VanEck group of companies gives any guarantee or assurance as to the repayment of capital, the payment of income, the performance, or any particular rate of return from the Fund.
The Fund invests in international markets. An investment in the Fund has specific and heightened risks that are in addition to the typical risks associated with investing in the Australian market. These include currency risks from foreign exchange fluctuations, ASX trading time differences and changes in foreign laws and regulations including taxation.
The Morningstar® Wide Moat Focus Index™ was created and is maintained by Morningstar, Inc. Morningstar, Inc. does not sponsor, endorse, issue, sell, or promote the US Fund and bears no liability with respect to the US Fund or any security. Morningstar®, Morningstar Wide Moat Focus Index™ and Economic Moat™ are trademarks of Morningstar, Inc. and have been licensed for use by VanEck. Effective June 20, 2016, Morningstar implemented several changes to the Morningstar Wide Moat Focus Index construction rules. Among other changes, the index increased its constituent count from 20 stocks to at least 40 stocks and modified its rebalance and reconstitution methodology. These changes may result in more diversified exposure, lower turnover and longer holding periods for index constituents than under the rules in effect prior to this date.


Published: 17 November 2019