In green health
Some rising stars in the health care sector are screened out of many sustainable international funds and ETFs due to sub-optimal and overly simplistic security selection screens. These funds often take a universal top-down approach as opposed to a bottom-up, industry specific methodology and robust framework designed to target ESG industry leaders.

During the COVID-19 global pandemic crisis the health care sector has exhibited defensive characteristics and continues to be the focus of investors’ attention.
Last week Gilead Sciences made headlines as reports surfaced about two of its late-stage coronavirus drug trials – the highly publicised Remdesivir is in multiple phase-3 clinical trials. Since then, leaked reports, which Gilead dispute, have surfaced and the outcome is unclear.
Irrespective, despite the fact that Gilead is aiming to make the world a better place for future generations, it is screened out of many sustainable international funds and ETFs due to sub-optimal and overly simplistic security selection screens. These funds often take a universal top-down approach as opposed to a bottom-up, industry specific methodology and robust framework designed to target ESG industry leaders.
As a result many sustainable international equity funds and ETFs have hyper-concentrated portfolios that rely only on negative screening and do not include positive assessments. The result is ineffective screens and sector biases which deliver sub-optimal exposures and diversification.
ESG to matter more in a post COVID-19 world
ESG had become an important consideration for investors prior to COVID-19 pandemic and post COVID-19 it is likely to be a subject of renewed focus. This is why it is important that investors target ESG leaders because those companies are best prepared to mitigate risks, have the best employee practices, and are best positioned to ensure the world is a better place for future generations.
Focusing on ESG leaders is an example of a ‘positive’ screen for ‘inclusion’ of only the best ESG companies. The problem with most ESG approaches is that they only have ‘negative’ screens for ‘exclusions’, so they could be missing out on important names and sectors.
It’s important to analyse how different companies operate within the same industry. For example, in the biotechnology industry, do they work with organisations like PETA (People for the Ethical Treatment of Animals) to ensure research meets its strict guidelines? Do they treat all life equally, or are they involved in unethical and inhumane practices? Only deep and broad ESG analysis can capture these types of considerations, but this research is easier said than done.
Accessing the right research through the right index
The state-of-the-art MSCI World ex Australia ex Fossil Fuel Select SRI and Low Carbon Capped Index (ESGI Index) uses MSCI’s best-of-breed ESG analysis, which is conducted by a team of over 190 analysts worldwide.
MSCI ESG Research assesses all of the stocks in its global universe on a 'AAA' to 'CCC' scale according to their exposure to industry specific ESG risks and their ability to manage those risks relative to peers. In addition to negative screens for fossil fuels, socially irresponsible business activities and carbon emissions, the ESGI Index includes only those companies that rank in the top 15% by market-cap for ESG performance from each GICS sector.
To go back to our original example, Gilead Sciences has risen over 25% since the beginning of the year despite the market’s overall fall. Gilead is rated AA by MSCI’s ESG team, which places it among the top 10% of its industry peers. Yet some ESG funds do not include it, simply because of the industry in which it operates.
Accessing the right index through the right ETF
There is only one ETF listed on ASX that tracks the MSCI World ex Australia ex Fossil Fuel Select SRI and Low Carbon Capped Index (ESGI Index), VanEck Vectors MSCI International Sustainable Equity ETF (ESGI).
Below we show the sector positions and highlight the active positions that ESGI and its peers have compared to the MSCI World ex Australia Index. The active position is calculated by subtracting the portfolio position from the index position. In the table the darker the orange the greater the active position from the global benchmark. The darkest orange represents sectors that vary from the MSCI World ex Australia Index by +/-10%. This is significant as you do not want your ESG global equity exposure to be a proxy sector bet.
By targeting only the top 15% ESG-rated companies by market-cap in each sector, ESGI maintains diversification across sectors and avoids concentration in any particular sector.
ESGI’s largest overweight positions are in healthcare and financials. It is underweight IT.
ETF 1 displays a significant exposure to the information technology sector and therefore the risks of that sector. ETF 2 has just a few exclusions so its exposures do not differ significantly from the benchmark.
|
GICS sector |
MSCI World ex Australia Index |
ESGI |
ETF 1 |
ETF 2 |
|
Number of holdings |
1,574 |
183 |
111 |
1,563 |
|
Consumer Discretionary |
10.3% |
13.4% |
12.7% |
11.3% |
|
Consumer Staples |
9.2% |
7.0% |
1.5% |
8.7% |
|
Energy |
3.4% |
0.0% |
0.0% |
0.9% |
|
Financials |
13.1% |
18.4% |
12.9% |
19.8% |
|
Health Care |
14.6% |
20.5% |
23.2% |
16.5% |
|
Industrials |
10.4% |
11.9% |
7.2% |
6.8% |
|
Information Technology |
19.5% |
12.7% |
32.5% |
22.9% |
|
Materials |
3.8% |
3.1% |
1.0% |
3.5% |
|
Real Estate |
3.1% |
2.5% |
3.6% |
3.3% |
|
Telecom. Services |
8.9% |
10.1% |
5.3% |
10.3% |
|
Utilities |
3.8% |
0.4% |
0.0% |
1.2% |
KEY:
|
Active Position (+/-) |
|
|
0-3% |
|
|
3%-5% |
|
|
5%-10% |
|
|
>10% |
|
Source: MSCI, VanEck, ETF 1 and ETF 2 websites. Data as at 31 March 2020
Focus on highly rated ESG companies - ESGI leads with AAA holdings
MSCI ESG Research shows that ESGI has 87% exposure to ESG leaders (AAA and AA rated ESG performing companies as determined by MSCI) and no exposure to ESG laggards (B and CCC rated companies). This is the highest distribution of AAA and AA in an International Sustainable Equity ETF or Fund in Australia.
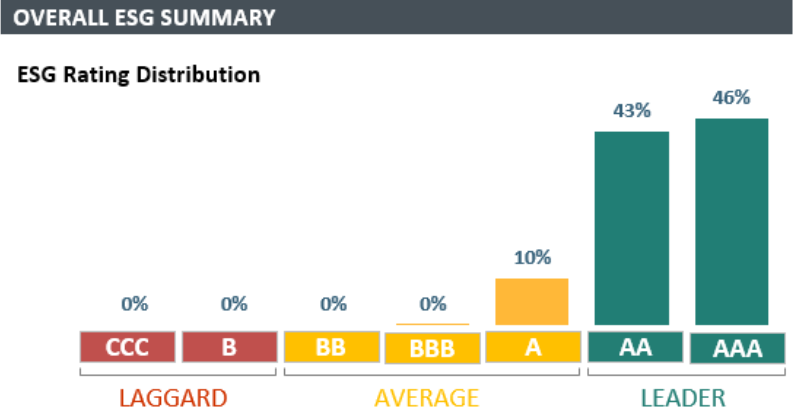
Source: MSCI ESG Research LLC 21 April, 2020
It’s not just MSCI who rate the fund highly. ESGI has received a High Morningstar Sustainability Rating™ and its Historical Sustainability Percent Rank places it in the top 1% of 6572 Global Equity Large Cap funds1.
Performance
ESGI also illustrates that ESG investors need not forgo financial returns in the pursuit of targeting those companies that have the best ESG scores in their industries and has outperformed the MSCI World ex Australia Index since its launch on ASX in 2018.
ESGI Performance to 31 March 2020
|
1 Mth |
3 Mths (%) |
6 Mths (%) |
1 Year (%) |
2 Years |
Since ESGI Inception* |
|
|
ESGI |
-5.49 |
-4.86 |
-0.15 |
11.51 |
8.88 |
8.53 |
|
MSCI World Ex Australia Index |
-8.32 |
-9.00 |
-5.13 |
4.44 |
8.29 |
7.86 |
|
Difference |
+2.83 |
+4.14 |
+4.98 |
+7.07 |
+0.59 |
+0.67 |
*Inception date is 6 March 2018. Source: Morningstar Direct, VanEck. The chart above shows past performance of ESGI and of the MSCI World ex Australia Index. Results are calculated to the last business day of the month and assume immediate reinvestment of distributions. ESGI results are net of management fees and other costs incurred in the fund, but before brokerage fees and bid/ask spreads incurred when investors buy/sell on the ASX. Returns for periods longer than one year are annualised. Past performance is not a reliable indicator of future performance.
This information is prepared in good faith by VanEck Investments Limited ABN 22 146 596 116 AFSL 416755 (‘VanEck’) as the responsible entity and issuer of VanEck Vectors MSCI International Sustainable Equity ETF ARSN 623 953 177 (‘ESGI’). This information is general advice only about financial products and not personal financial advice. It does not take into account any person's individual objectives, financial situation or needs. Before making an investment decision investors should read the product disclosure statement and with the assistance of a financial adviser consider if it is appropriate for their circumstances. A copy of the PDS is available at www.vaneck.com.au. The fund is subject to investment risk, including possible loss of capital invested. The PDS details the key risks. No member of the VanEck group guarantees the repayment of capital, the payment of income, performance, or any particular rate of return from the Fund. ESGI is indexed to a MSCI index. ESGI is not sponsored, endorsed, or promoted by MSCI, and MSCI bears no liability with respect to ESGI or the MSCI Index. The PDS contains a more detailed description of the limited relationship MSCI has with VanEck and ESGI.
1 - Out of 6572 Global Equity Large Cap funds as of 29/02/2020. Based on 99.96% of AUM. Data is based on long positions only. Historical Sustainability Score as of 31/03/2020. Sustainability Rating as of 29/02/2020. Sustainalytics provides company-level analysis used in the calculation of Morningstar’s Historical Sustainability Score.


Published: 27 April 2020
Related Insights