Global Listed Private Credit vs Australian Private Credit LITs
VanEck recently launched Australia’s first global listed private credit ETF (ASX: LEND). The ETF tracks the LPX Listed Private Credit AUD Hedged Index (LEND Index) which gives investors exposure to a portfolio of 25 of the largest listed companies involved in private credit.
Many investors would be familiar with the range of Australian Private Credit Listed Investment Trusts (LITs) on the ASX. How does global listed private credit compare? Below, we’ve outlined three areas where global private credit is superior:
- Holdings transparency;
- Liquidity; and
- Sector diversification.
Holdings transparency
For a constituent to be included in the LEND index, the portfolio company has to provide a sufficient look through to the underlying holdings. US Business Development Companies (BDCs), which currently account for 100% of LEND exposure, disclose holdings thus improving price discovery. Below is an example of Blackstone Secured Lending Fund, the largest constituent in LEND. The file provides detailed information including the interest rate, maturity date and notional value of each loan.
Exhibit 1: Blackstone Secured Lending Fund Portfolio Holdings
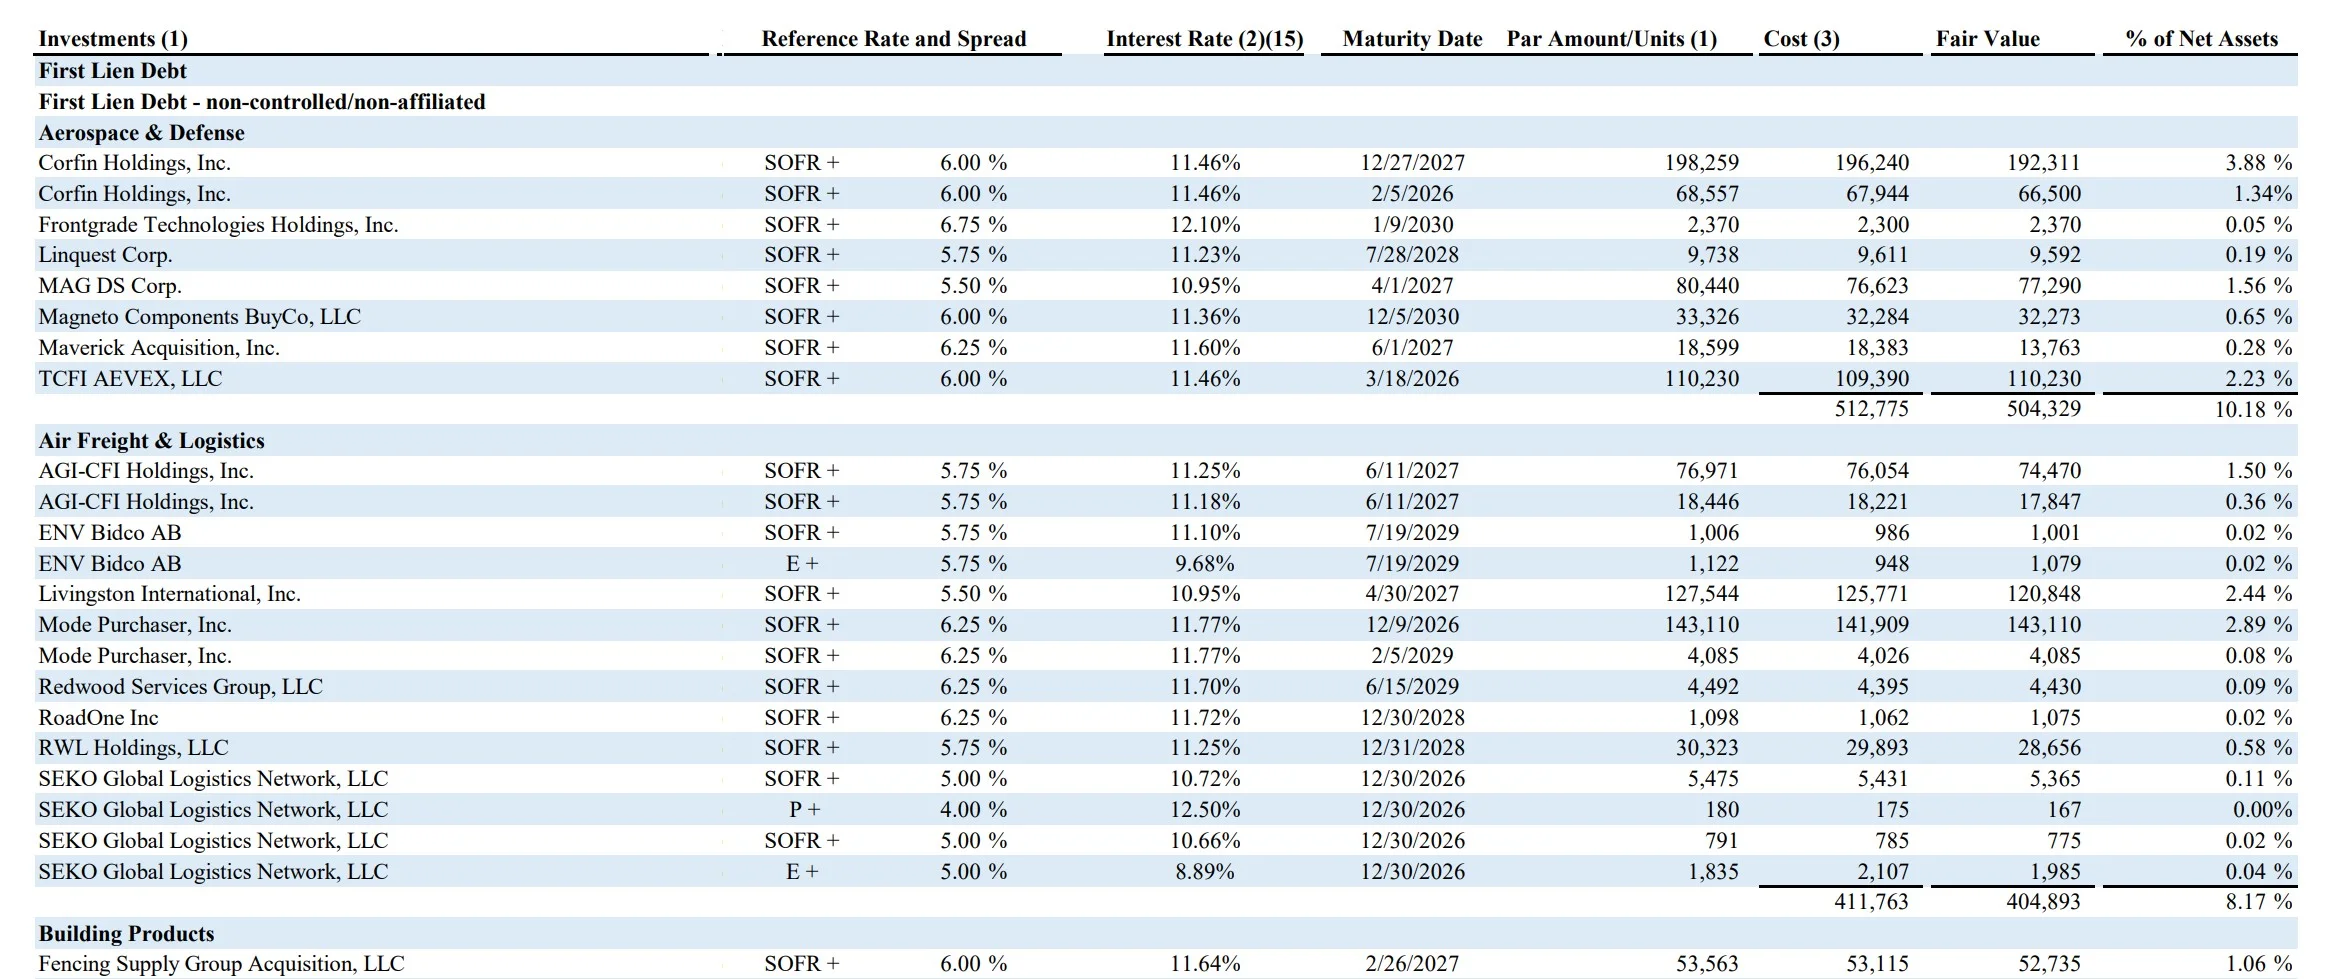
 Source: Blackstone, As at 31 December 2023.
Australian Private Credit LITs do not publish underlying holdings which leaves investors to rely on the published NAV and to guess the broader market conditions to estimate a fair price, limiting price discovery.
The graph below demonstrates how LEND performance is more responsive to market conditions relative to a LIT (we have used Metrics Master Income Trust (ASX: MXT) as an example). The chart shows that over the past six months, the index LEND tracks has shown to have a high correlation with the performance of US high yield, capturing the change in perceived credit risk of portfolio companies.
Exhibit 2: Six month performance comparison: LEND Index, MXT and US High Yield Index
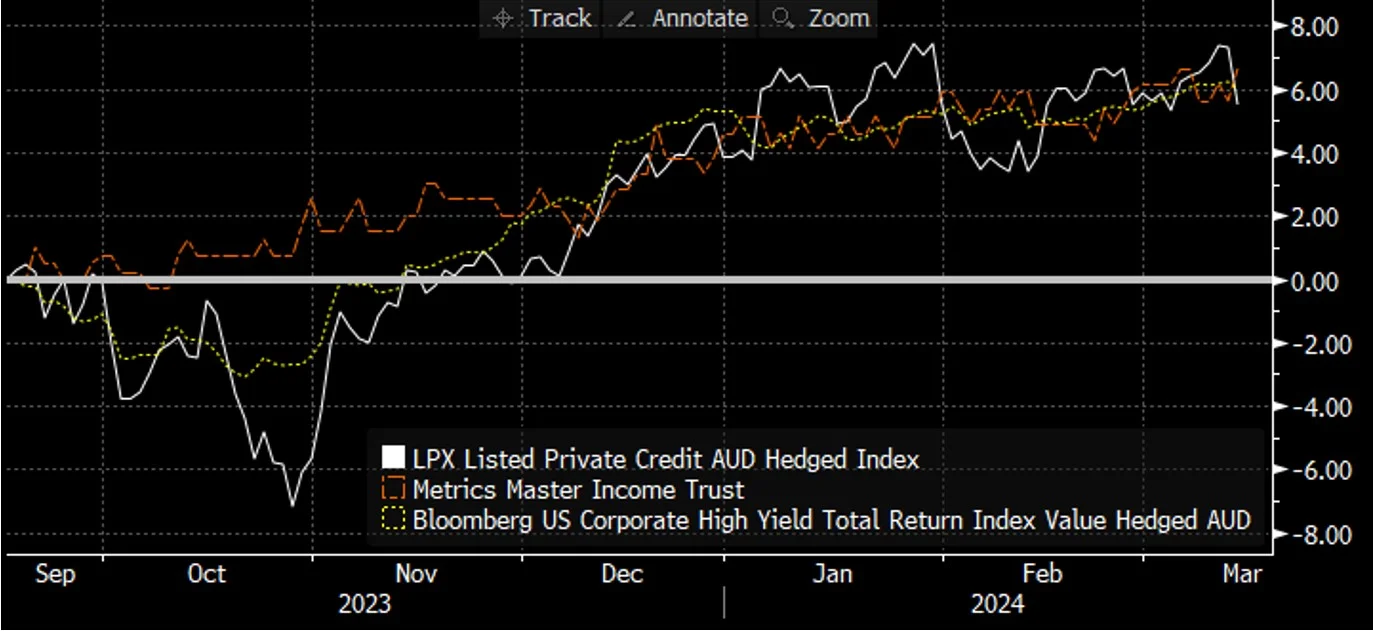
Source: Bloomberg, as at 20 March 2024. You cannot invest in an index. Past Performance is not indicative of future performance.
Liquidity
Higher trading volume often indicates increased market interest, liquidity and better order execution, which can lead to more accurate price discovery. Over the past thee months, trade volume as a percentage of total shares outstanding for LEND constituents was roughly three times higher than MXT (0.61% versus 0.17%).
Sector Diversification
Growth in the private credit market is an unparalleled global phenomenon. We’ve seen private credit increasingly taking over the core business of traditional banks, that is, the provision of debt capital to medium-sized companies and real estate. However, given the smaller scale of the Australian market, private credit transactions here are concentrated to real estate. This limits sector diversification.
Globally, private credit transactions are diverse, across many sectors and with a larger pool of borrowers. Private credit has been pivotal in scaling up technology infrastructure and enhancing workflow efficiencies while allowing business owners to retain equity stakes.
Exhibit 3: Australian Private Credit LIT sector breakdown
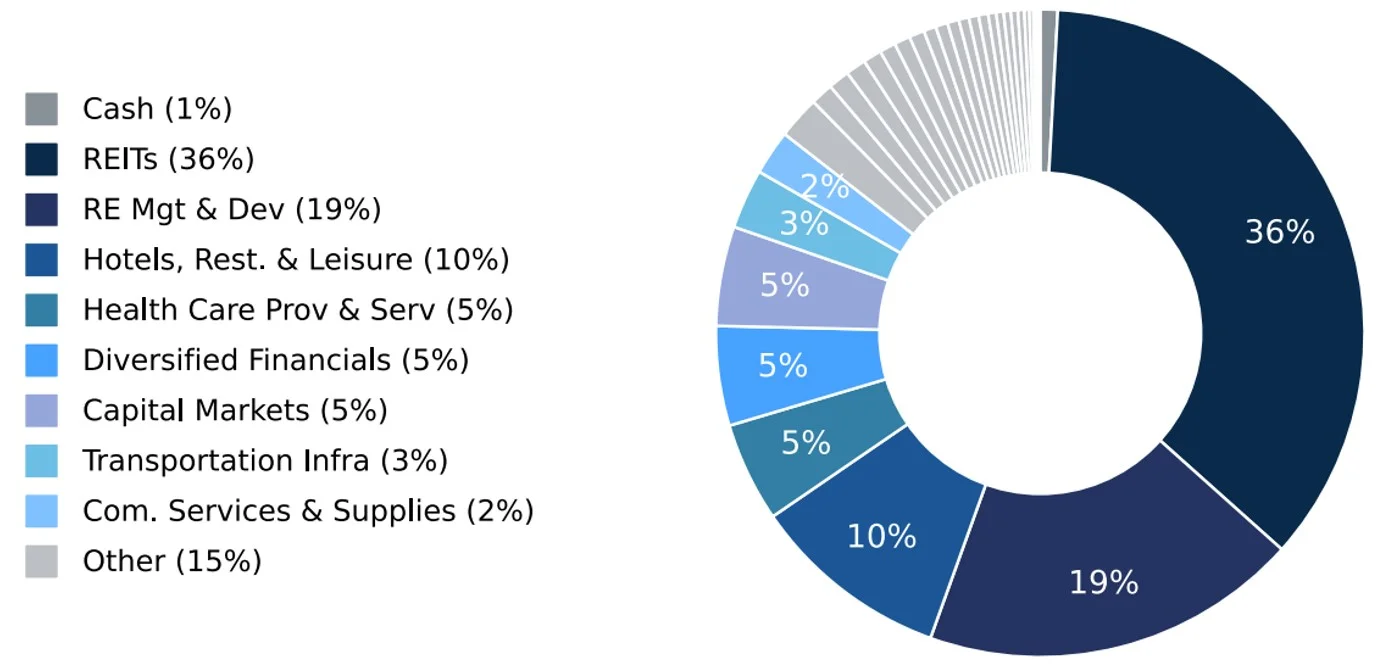
As at 31 December 2023.
Exhibit 4: LEND Index sector breakdown
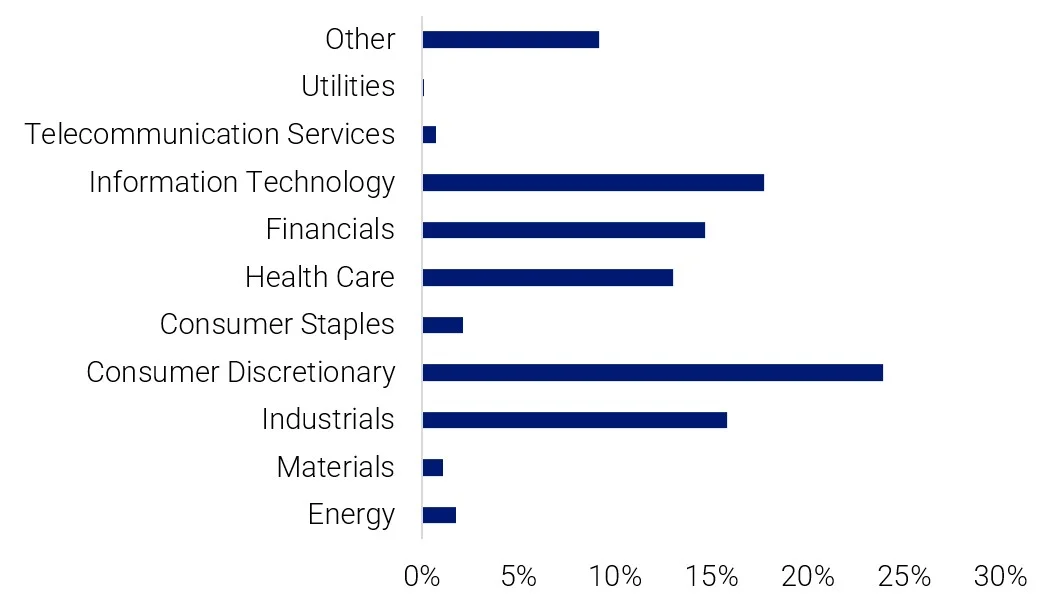
Source: LPX Listed Private Credit (AUD Hedged Index) constituents average (total private equity portfolio look through); As at 29 February 2024.
Key risks
An investment in the ETF carries risks associated with: listed private credit, interest rates, credit/default, currency hedging, ASX trading time differences, financial markets generally, individual company management, industry sectors, country or sector concentration, political, regulatory and tax risks, fund operations, liquidity and tracking an index. See the PDS for more details on risk.


Published: 25 March 2024
Any views expressed are opinions of the author at the time of writing and is not a recommendation to act.
VanEck Investments Limited (ACN 146 596 116 AFSL 416755) (VanEck) is the issuer and responsible entity of all VanEck exchange traded funds (Funds) trading on the ASX. This is general advice only and does not take into account any person’s financial objectives, situation or needs. The product disclosure statement (PDS) and the target market determination (TMD) for all Funds are available at vaneck.com.au. You should consider whether or not an investment in any Fund is appropriate for you. Investments in a Fund involve risks associated with financial markets. These risks vary depending on a Fund’s investment objective. Refer to the applicable PDS and TMD for more details on risks. Investment returns and capital are not guaranteed.