Top 10 lists always miss something
Another financial year has come and gone, and in its wake we’re once again faced with a deluge of 'top 10 funds' lists in the media. While these league tables are great publicity for funds that find themselves on top, they aren’t so great at capturing the whole market. Advisors and investors could also finish in the top 10.
Australia’s only dedicated financial and business newspaper, the Australian Financial Review (AFR) has published no fewer than five articles since the end of the financial year containing tables highlighting the best performing funds of the year:
- 18 July 2019 - Mercer names best-performing Aussie share funds
- 19 July 2019 - Top fundies warn on valuation risk
- 19 July 2019 - Where the money was made in ETFs
- 23 July 2019 - Global funds - the 2019 winners and losers
- 27 July 2019 - Revealed: Super's top performers
The most recent of these piqued our interest because we had recently written a Vector Insights on balanced and growth funds. This article is also important because many Australians have their superannuation invested in balanced and growth options as these are generally the ‘default’ option most of us end up in. Unbeknown to us at the time of writing our previous post, we were giving investors a window into building balanced and growth strategies using low-cost ETFs which would have been among the top performing when compared to those that appeared in the AFR. The results illustrate how using a combination of traditional market capitalisation and smart beta ETFs, not all VanEck ones, as simple building blocks in a portfolio you can achieve robust outcomes for low costs.
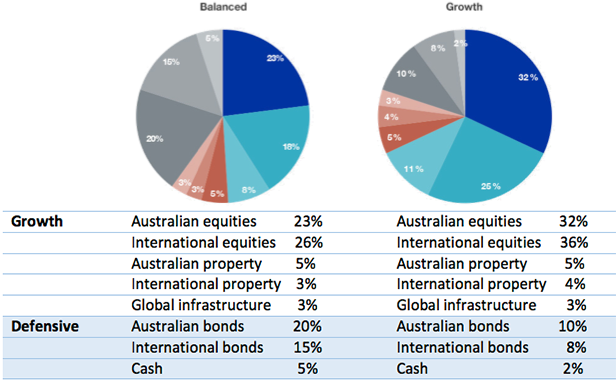
Below are our example asset allocations for balanced and growth portfolios. Like the growth and balanced superannuation funds identified by Chant West in the AFR article, these both have around 60% to 80% allocation to growth assets.
Warning: This is general advice only about financial products and not personal financial advice. It does not take into account any person’s individual objectives, financial situation or needs. Before making any asset allocation or investment decision, you should seek personal financial advice from a licensed financial adviser to determine your risk profile and financial products that are appropriate for your personal circumstances.
Tables 1 and 2 below show the returns of our model ETF portfolios based on the asset allocations outlined above. These models have been running since April 2016 and include ETFs from a number of ETF issuers, taking a best-of-breed approach. We have used ETFs that track traditional market cap weighted benchmark indices for Australian bonds, International bonds, Global Infrastructure and International Property. For Australian equities and Australian property we use smart beta ETFs and for International equities we use a combination of market capitalisation and smart beta ETFs.
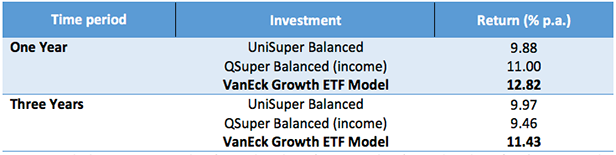
In both cases the VanEck model delivered the highest returns over one year compared to the best performing balanced or growth superannuation portfolios reported in the AFR. Over three years to 30 June 2019, the VanEck Growth ETF model was also the best performing portfolio.
Table 1. Best performing super growth fund (61% to 80% allocation to growth assets/ 20% to 39% allocation to defensive assets) over one year to 30 June 2019 versus VanEck Balanced ETF Portfolio Model (60% growth / 40% defensive assets)
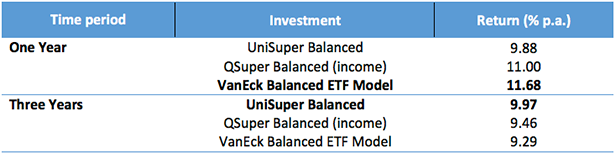
Table 2. Best performing super growth fund (61% to 80% allocation to growth assets/ 20 to 39% allocation to defensive assets) over 12 months to 30 June 2019 versus VanEck Growth ETF Portfolio Model (80% growth / 20% defensive assets)
Source: VanEck, Chant West, QSuper website (accessed 30 July 2019) UniSuper website (accessed 30 July 2019), Performance period ending 30 June 2019. Results are calculated daily to the last business day of the month and assume immediate reinvestment of all dividends. Results are net of management costs but do not include brokerage costs of investing in the ETFs. Performance on is not a reliable indicator of future performance. Assume rebalanced at the end of each calendar year. The RBA cash rate is used for cash.
ETFs used in VanEck Models: International Bonds – Vanguard International Fixed Interest Index ETF (Hedged), Australian Bonds – iShares Core Composite Bond ETF, International Equities – Vanguard MSCI Index International Shares ETF & VanEck Vectors MSCI World ex Australia Quality ETF, Australian Equities – VanEck Vectors Australian Equal Weight ETF, International Real Estate - SPDR Dow Jones Global Real Estate ETF, Global Infrastructure -VanEck Vectors FTSE Global Infrastructure (Hedged) ETF, Australian Property – Vanguard Australian Property ETF.
Warning: This is general advice only about financial products and not personal financial advice. It does not take into account any person’s individual objectives, financial situation or needs. The ETFs are named for illustrative purposes only and this does not constitute a recommendation of any financial products or product issuers. Before making any asset allocation or investment decision, you should seek personal financial advice from a licensed financial adviser to determine your risk profile and financial products that are appropriate for your personal circumstances and read the PDS.
Financial Express Index
Going further, when comparing a portfolio of multi-asset products against a benchmark, Australian research house Lonsec recommend you use the Financial Express (FE) multi-asset benchmarks. Below we compare the VanEck ETF Models to their relevant FE benchmark.
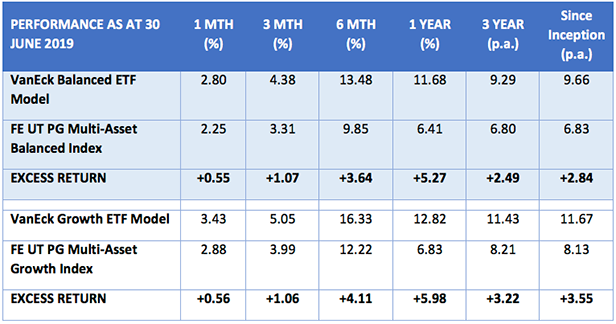
*Inception is the ASX listing date of VanEck Vectors FTSE Global Infrastructure (Hedged) ETF which was 29 April 2016
Source: VanEck, Performance period ending 30 June 2019. Results are calculated daily to the last business day of the month and assume immediate reinvestment of all dividends. Results are net of management costs but do not include brokerage costs of investing in the ETFs. Performance on is not a reliable indicator of future performance.
Putting in into practice: ETFs are ideal tools for building robust portfolios.
It’s no wonder more and more investors are flocking to ETFs for their ease of use, low costs and transparency. As we’ve illustrated above they are also ideal building blocks for building diversified portfolios:
- They allow investors to access asset classes they otherwise could not. For example, until recently only infrastructure and global real estate, that have been pillars of institutional portfolios, have been difficult to access;
- Smart Beta ETFs allow investors to target investment outcomes; and
- ETFs allow investors and their advisers to be investment strategists, allowing them to buy (or dispose of) sectors and regions they think will outperform (or fall);
ETFs are ideal building blocks for portfolio construction.
For more information about VanEck’s model portfolios speak to you financial adviser.
Issued by VanEck Investments Limited ABN 22 146 596 116 AFSL 416755 (‘VanEck’). VanEck is the responsible entity and issuer of units in the VanEck Vectors ETFs traded on ASX. This is general advice only about financial products and not personal financial advice. It does not take into account any person’s individual objectives, financial situation or needs. Before making an investment decision, you should read the relevant PDS and with the assistance of a financial adviser consider if it is appropriate for your circumstances. VanEck PDSs are available at www.vaneck.com.au or by calling 1300 68 38 37. PDSs of other issuers' ETFs are available from their websites. No member of VanEck group of companies gives any guarantee or assurance as to the repayment of capital, the payment of income, the performance, or any particular rate of return of any funds. Past performance is not a reliable indicator of future performance.


Published: 02 August 2019