The times, they are a-changing. Has your portfolio?
- Emerging market economies have gone from being in deficit to running up surpluses while developed market economies have been accruing deficits and this shift has resulted in a shift in the origination of bond crises.
- Bond portfolios have yet to reflect this new reality and new research suggests that investors should include or increase their allocation to emerging markets bonds for long-term portfolios.
Over the past 30 years a shift has occurred. Emerging markets economies have gone from being in deficit to running up surpluses. At the same time, developed market economies have been accruing deficits. The outcome of this has been a shift in the origination of bond crises. Before the end of the century, bond crises were a feature of emerging markets. Since 1998, all financial crises have involved the large DMs.
Chart 1: Emerging markets and developed markets current account balances, % GDP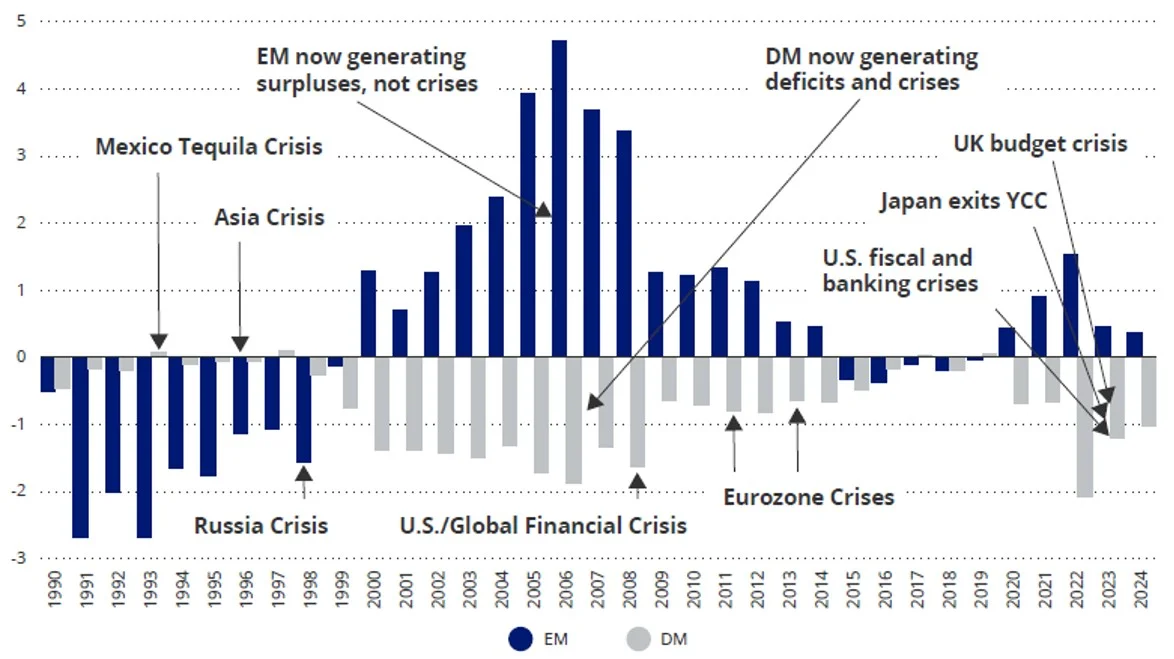
Source: Bloomberg, 31 December 2023
If we look back at those 25 years, the result has been that emerging markets bonds have outperformed developed markets bonds and many investors’ portfolios were not positioned for this reality. When we launched the VanEck Emerging Income Opportunities ETF Active ETF (Managed Fund) (EBND) at the start of 2020 as COVID lockdowns were starting to take effect, we produced a paper that analysed fixed income options using a tool made famous by Modern Portfolio Theory (MPT), the Efficient Frontier.
In MPT, the efficient frontier suggests the most ‘efficient’ investment portfolios to generate returns for a set level of risk. The risk measure used is the standard deviation of returns. The higher the standard deviation, the higher the returns that could be generated. The 2020 paper found that for a moderate level of risk, say 5% to 9%, the efficient frontier analysis suggested “that the majority of a fixed income portfolio should be invested in emerging markets hard currency bonds (represented by EMBIG).”
Below is an update of the data presented in the 2020 paper.
Chart 2: Australian investor’s fixed income portfolio efficient frontier, 1 January 2004 to 31 December 2023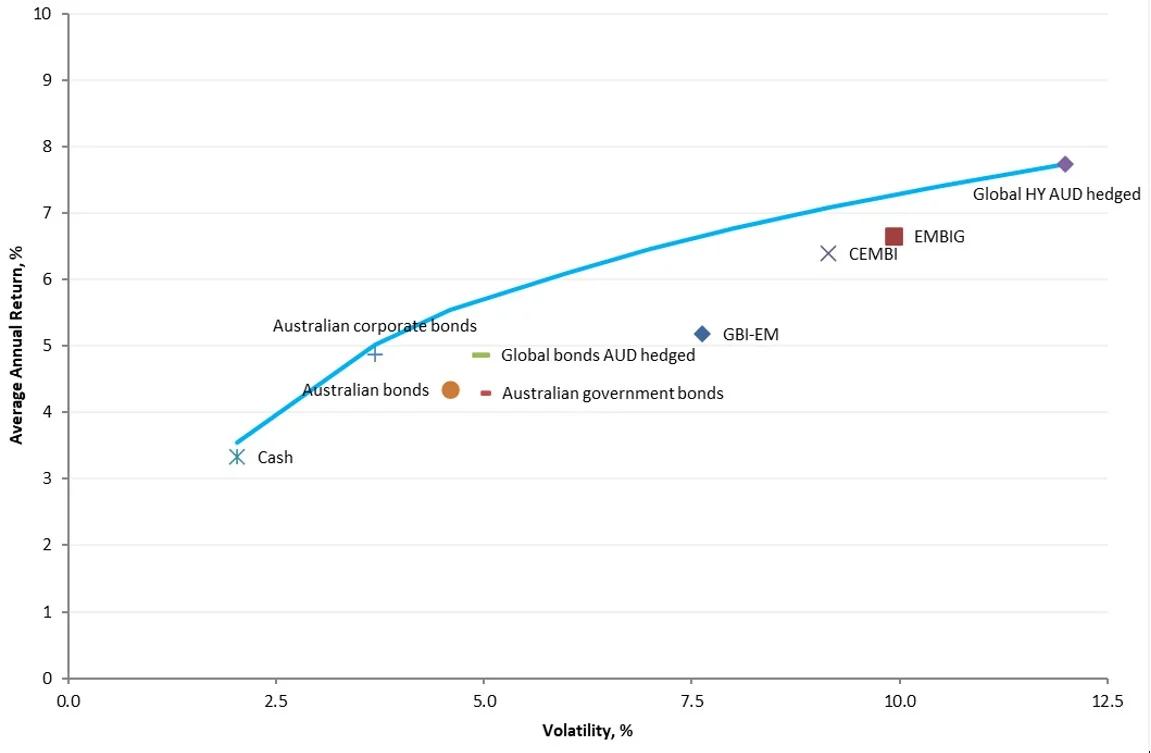
Source: Bloomberg, VanEck, 31 December 2023. Results are calculated annually and assume immediate reinvestment of all dividends. Volatility is the Standard Deviation of returns. You cannot invest in an index. Past performance is not a reliable indicator of future performance. Indices used: Cash – Bloomberg Australian Bank Bill 0+ Yr Index; Global Bonds AUD hedged – Barclays Global Aggregate Bond Index A$ Hedged; Australian Bonds – Bloomberg AusBond Composite Index; Australian corporate bonds – Bloomberg AusBond Credit 0+Yr Index; Australian government bonds – Bloomberg AusBond Australia Government Bond; GBI-EM is EM local - J.P. Morgan Government Bond Index-Emerging Markets Global Diversified (GBI-EM); EMBIG is EM hard currency - J.P Morgan Emerging Markets Bond Index Global Diversified (EMBIGD) – EMBIGD is unhedged, EBND hedges its hard currency; CEMBI – J.P Morgan Corporate Emerging Markets Bond Index (CEMBI); Global HY AUD hedged – Bloomberg Barclay Global High Yield Index A$ Hedged.
In summary, the maths again suggests1, like it did four years ago, that fixed income portfolios should have sizable allocation to emerging markets bonds. While the maths again suggests unreasonably high allocations, from a diversification point of view (diversification being another tenant of modern portfolio theory), the evidence like the previous paper suggests that an allocation of more than zero is appropriate for emerging markets bonds.
Savvy investors that took advantage of EBND have benefited since its inception. While the struggles in developed market bonds over the past three years have been well noted, emerging markets bonds have starred. As always, we note that past performance is not a reliable indicator of future performance.
Table 1: EBND performance as at 31 January 2024 compared to the performance of developed markets bonds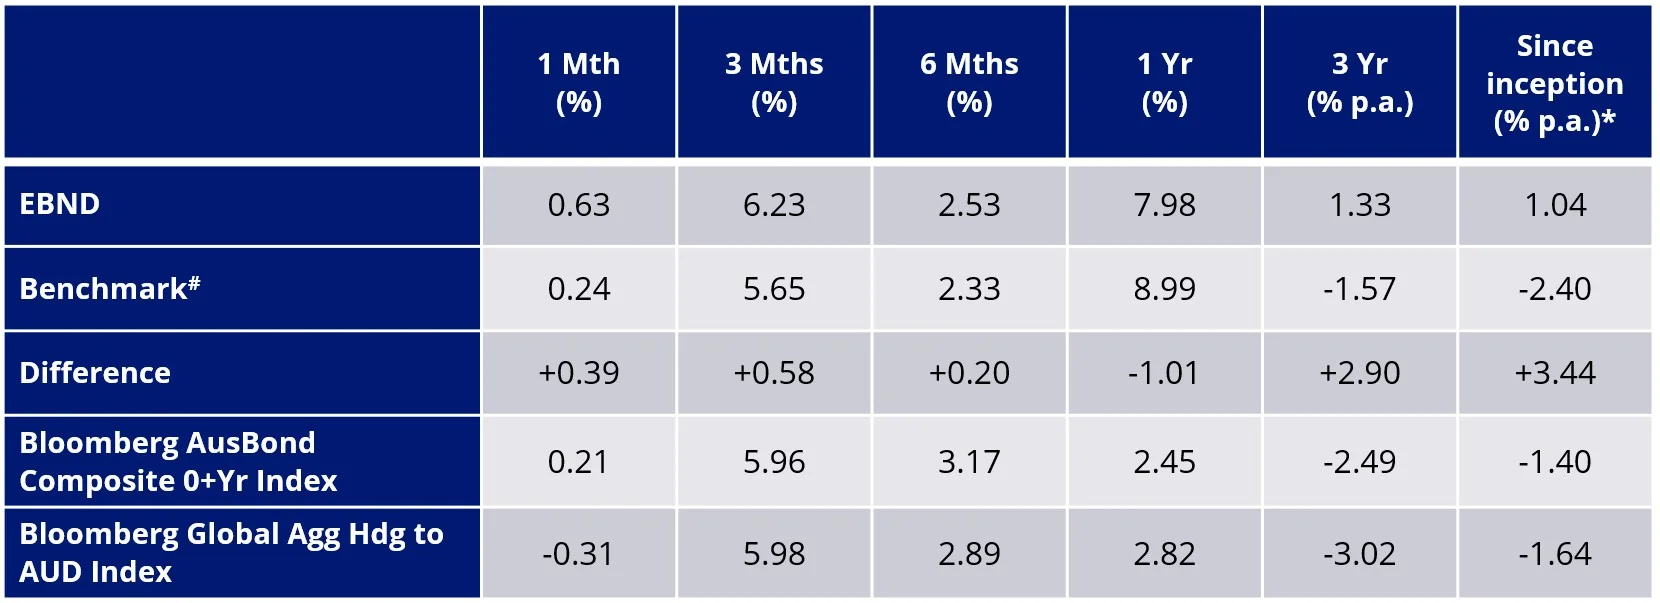
* Inception date is 11 Feb 2020
# EBND’s benchmark is 50% J.P. Morgan Emerging Market Bond Index Global Diversified Hedged AUD and 50% J.P. Morgan Government Bond-Emerging Market Index Global Diversified.
Source: VanEck. Results are calculated to the last business day of the month and assume immediate reinvestment of distributions. EBND results are net of management costs and expenses, but before brokerage fees or bid/ask spreads incurred when investors buy/sell on the ASX. Past performance is not a reliable indicator of future performance. See fact sheet below for performance since inception. The Bloomberg AusBond Composite 0+ Yr Index is the widely recognised benchmark used to measure the performance of the broad Australian bond market, weighted by market value. It is used here for comparison purposes only as a developed bond market. The Bloomberg Global Agg Hdg to AUD Index the widely recognised benchmark used to measure the performance of the broad developed global bond market, weighted by market value. It is used here for comparison purposes only as the representative of global developed market bonds.
But it is not too late for investors to include or increase their allocation to emerging markets bonds for long term portfolios. That is a key message of new research, released last week by VanEck’s Head of Emerging Market Debt, Eric Fine and VanEck’s Chief Economist Natalia Gurushina. Eric and Natalia, if anything, they find emerging market’s long-term outperformance is showing deeper strengths.
The research is titled, Fiscal dominance: Emerging markets' upper-hand. Fiscal dominance, according to the paper, is an economic condition that arises when debts and deficits are so high that monetary policy loses traction.
A feature of fiscal dominance is government debt.
Where, 20 years ago fiscal dominance may have characterised emerging market economies, it now appears to characterise developed markets and the shift in this dynamic is reflective of the performance of bond markets. Emerging markets bonds have outperformed developed markets bonds over the past 20 years.
But will this continue?
The new paper analyses the history of ‘fiscal dominance’ and its implications for portfolios going forward, arguing that there are long-term tailwinds for emerging markets bonds, in particular, local currency bonds.
The new stars of bond markets
Emerging market economies came to the fore during the global crisis in 2008/2009. Many emerging markets economies came out of the GFC structurally stronger than their developed market counterparts. Several emerging markets governments were able to better implement counter-cyclical fiscal expansion to reignite growth because of their growing foreign exchange reserves, strong budgets and robust balance of payments. In fact, emerging markets were part of the answer to stimulate global growth. China, for example, was able to increase fiscal and monetary stimulus in response to the crisis. In the old days, they would have had to do the exact opposite, bunkering down and tightening, to then suffer a much worse crisis.
Some emerging markets countries didn't even go through recession during the GFC. The GFC is but one example this century, emerging markets successfully navigated 2013’s ‘taper tantrum’ and were the stars of the more recent COVID crisis and subsequent rate hiking cycle.
2013’s taper tantrum was a consequence of the Fed signalling that it was going to end the latest phase of its quantitative easing. While at the time, then Fed chairman, Ben Bernanke did not announce an interest rate hike, the market reacted like he did and became concerned about countries with large current account deficits. With significant reserves many emerging markets let their currencies weaken and they let their interest rates rise. By weakening their currency and hiking interest rates directly they could address their current account deficit. In this way, the taper tantrum proved, emerging markets were no longer dependent on US dollar debt. A similar episode may well have crippled some emerging markets in the 1990s because they didn’t have the reserves.
During the recent rating hiking cycle emerging markets, we would argue were the rate-hiking champions. The recent global tightening cycle was led by emerging markets, which started hiking earlier and larger than the Fed and RBA in order to address rising inflation pressures. As a result, their hikes were not needed to be as fast resulting, for the most part, in a smoother hiking cycle, having already started easing.
Chart 3: Policy rates in major emerging markets and developed markets (%)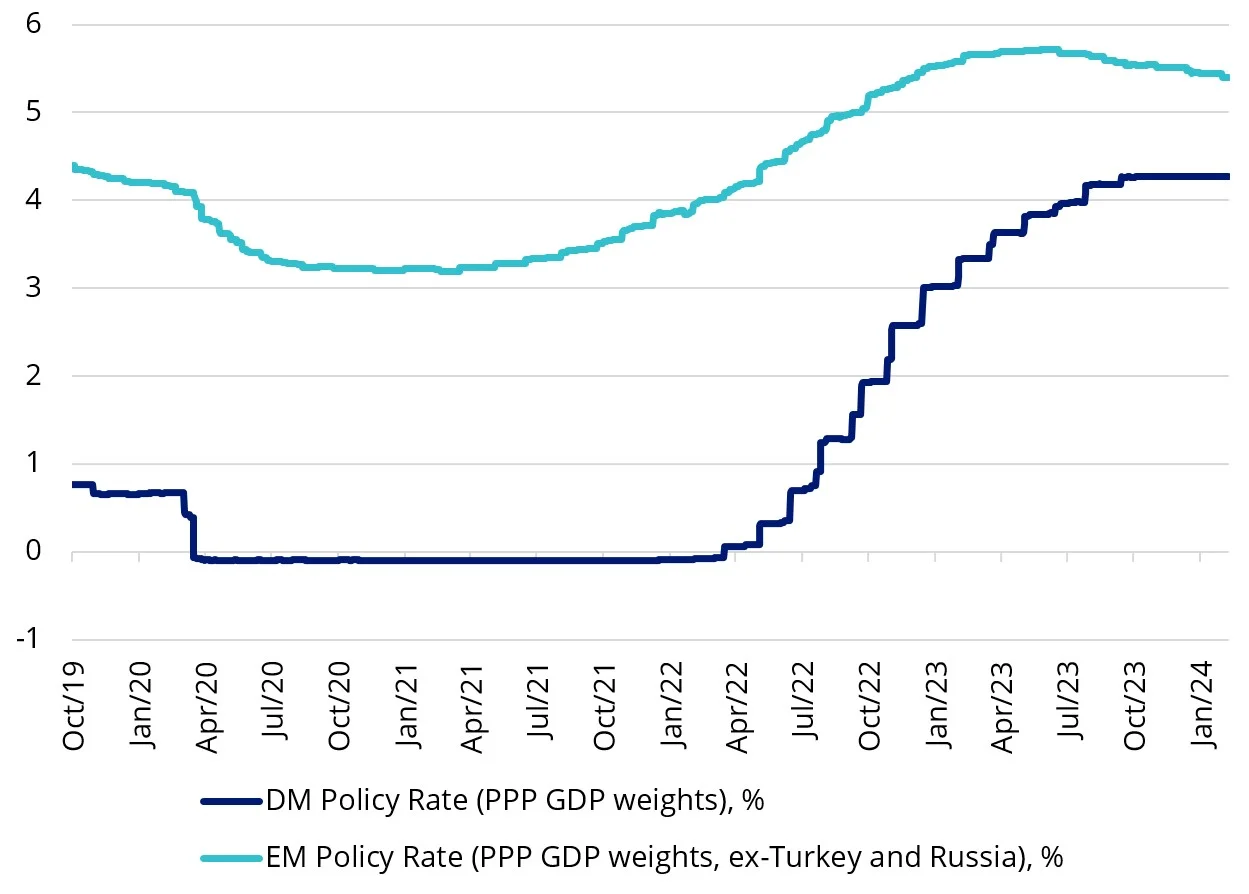
Source: Bloomberg.
The new fiscal dominance paper argues that emerging markets, relative to developed markets, will continue to be strong going forward. A beneficiary of this, the paper’s authors think, will be emerging markets local currency bond markets.
And while many fixed income portfolios remain underweight emerging markets, we think it's only a matter of time before more and more investors will start to include them in their portfolios.
Because of the idiosyncrasies between the nations included in the emerging markets universe and the nuances between the different types of bonds available, we think an active, unconstrained approach, like the one employed by EBND is an ideal way for investors to access this important asset class.
You can read the new research here. Past research on the efficient frontier is available here and here
Key risks: An investment in EBND carries risks associated with: ASX trading time differences, emerging markets bonds and currencies, bond markets generally, interest rate movements, issuer default, currency hedging, credit ratings, country and issuer concentration, liquidity, fund manager and fund operations. See the PDS for details.
1Table 2: Australian fixed income portfolio implied weights from efficient frontier, 1 Jan 2004, to 31 December 2023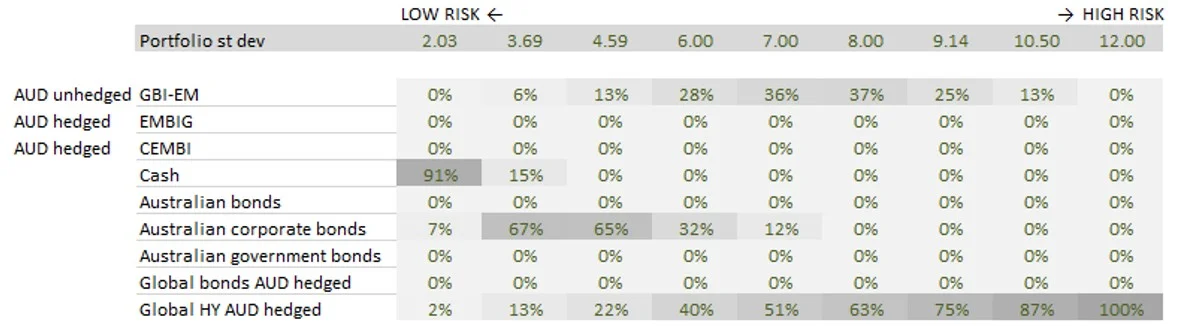
Source: Bloomberg, VanEck, 31 December 2023. Results are calculated annually and assume immediate reinvestment of all dividends. Volatility is the Standard Deviation of returns. You cannot invest in an index. Past performance is not a reliable indicator of future performance. Indices used: Cash – Bloomberg Australian Bank Bill 0+ Yr Index; Global Bonds AUD hedged – Barclays Global Aggregate Bond Index A$ Hedged; Australian Bonds – Bloomberg AusBond Composite Index; Australian corporate bonds – Bloomberg AusBond Credit 0+Yr Index; Australian government bonds – Bloomberg AusBond Australia Government Bond; GBI-EM is EM local - J.P. Morgan Government Bond Index-Emerging Markets Global Diversified (GBI-EM); EMBIG is EM hard currency - J.P Morgan Emerging Markets Bond Index Global Diversified (EMBIGD) – EMBIGD is unhedged, EBND hedges its hard currency; CEMBI – J.P Morgan Corporate Emerging Markets Bond Index (CEMBI); Global HY AUD hedged – Bloomberg Barclay Global High Yield Index A$ Hedged.


Published: 11 February 2024
Any views expressed are opinions of the author at the time of writing and is not a recommendation to act.
VanEck Investments Limited (ACN 146 596 116 AFSL 416755) (VanEck) is the issuer and responsible entity of all VanEck exchange traded funds (Funds) trading on the ASX. This is general advice only and does not take into account any person’s financial objectives, situation or needs. The product disclosure statement (PDS) and the target market determination (TMD) for all Funds are available at vaneck.com.au. You should consider whether or not an investment in any Fund is appropriate for you. Investments in a Fund involve risks associated with financial markets. These risks vary depending on a Fund’s investment objective. Refer to the applicable PDS and TMD for more details on risks. Investment returns and capital are not guaranteed.