Quality companies shine amid gloom of war
There are signs that the US economy may not be able to sustain its current momentum. Along with the huge geopolitical and economic uncertainty that Russia’s aggressive war against Ukraine has created across economies, this could push international quality stocks to outperform.
Interest rates are rising and war is being waged in Europe by an aggressive Russia. Volatility has returned to global equity markets. Fears are growing of a global recession, with the possibility of stagflation.
Reflecting rising fears about a slowdown in US economic growth, the Treasury yield curve has inverted this month. The bond market is flashing warning signs that the US economy could be headed for recession. With US official interest rates set to jump too this year, quality shares as represented by the VanEck MSCI International Quality ETF (QUAL) outperformed in March.
As the Australian dollar strengthened the Australian dollar hedged version of QHAL experienced strong positive performance in March.
The tables below highlights this recent performance.
Table 1: QUAL Performance as at 31 March 2022
|
1 Mth |
6 Mths |
1 Year |
3 Years |
5 Years |
7 Years |
Since Inception |
|
|
QUAL |
-0.22 |
-3.31 |
13.14 |
15.96 |
16.18 |
13.46 |
15.75 |
|
MSCI World ex Australia Index |
-0.89 |
-1.84 |
11.60 |
12.93 |
12.88 |
10.68 |
12.98 |
|
DIFFERENCE |
+0.67 |
-1.47 |
+1.54 |
+3.03 |
+3.30 |
+2.78 |
+2.77 |
Source: Morningstar Direct, VanEck. QUAL inception date is 29 October 2014 and a copy of the factsheet is here.
The table above shows past performance of QUAL and of the MSCI World ex Australia Index. You cannot invest directly in an index. Results are calculated to the last business day of the month and assume immediate reinvestment of distributions. QUAL results are net of management fees and other costs incurred in the fund, but before brokerage fees and bid/ask spreads incurred when investors buy/sell on the ASX. Returns for periods longer than one year are annualised. Past performance is not a reliable indicator of future performance. The MSCI World ex Australia Index (“MSCI World ex Aus”) is shown for comparison purposes as it is the widely recognised benchmark used to measure the performance of developed market large- and mid-cap companies, weighted by market capitalisation. QUAL’s index measures the performance of 300 companies selected from MSCI World ex Aus based on MSCI quality scores, weighted by market cap x quality score at rebalance. Consequently QUAL’s index has fewer companies and different country and industry allocations than MSCI World ex Aus.
Table 1: QHAL Performance as at 31 March 2022
|
1 Mth |
6 Mths |
1 Year |
3 Years |
Since Inception |
|
|
QHAL |
3.37 |
0.47 |
11.80 |
16.33 |
16.06 |
|
MSCI World ex Australia |
2.88 |
2.48 |
10.85 |
13.58 |
13.20 |
|
DIFFERENCE |
+0.49 |
-2.01 |
+0.23 |
+2.75 |
+2.86 |
Source: Morningstar Direct, VanEck. QHAL inception date is 21 March 2019 and a copy of the factsheet is here.
The table above shows past performance of QHAL and of the MSCI World ex Australia 100% Hedged to AUD Index. You cannot invest directly in an index. Results are calculated to the last business day of the month and assume immediate reinvestment of distributions. QHAL results are net of management fees and other costs incurred in the fund, but before brokerage fees and bid/ask spreads incurred when investors buy/sell on the ASX. Returns for periods longer than one year are annualised. Past performance is not a reliable indicator of future performance. The MSCI World ex Australia 100% Hedged to AUD Index (‘MSCI World ex Aus Hedged’) is shown for comparison purposes as it is the widely recognised benchmark used to measure the performance of developed market large- and mid-cap companies, weighted by market capitalisation. QHAL’s index measures the performance of 300 companies selected from MSCI World ex Aus Hedged based on MSCI quality scores, weighted by market cap x quality score at rebalance. Consequently QHAL’s index has fewer companies and different country and industry allocations than MSCI World ex Aus Hedged.
The question is will quality’s outperformance continue?
US economy on the edge
The US Federal Reserve commenced monetary tightening in March and expects US rates to be raised at every board meeting until the end of the year with hikes above 25 basis points plausible. US inflation is sitting at a 40 year high. The market expects US rates to reach 2.36 percent by the end of 20221. US Fed Chair Powell stated recently that despite aggressive anticipated rate rises, “I don’t see a reason to think that the likelihood of a recession in the next year is elevated and the main reason I don’t see that is because the economy is very, very strong.”
However, economic indicators paint a different story – and financial markets see recession as a risk, as the inverted US yield curve suggests. With inflation rising so quickly, stagflation too is a risk, that is, the combination or rising inflation and little or no economic growth as global supply chain bottlenecks choke growth.
Chart 1: US Urban Consumers CPI YoY 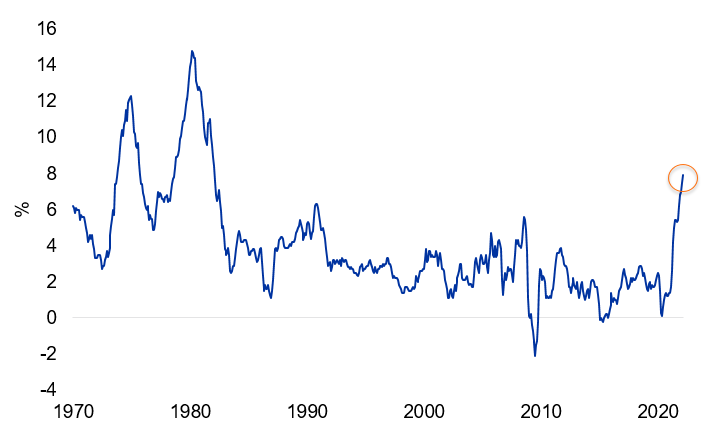
Source: Bloomberg
Chart 2: 30 day Fed fund futures curve 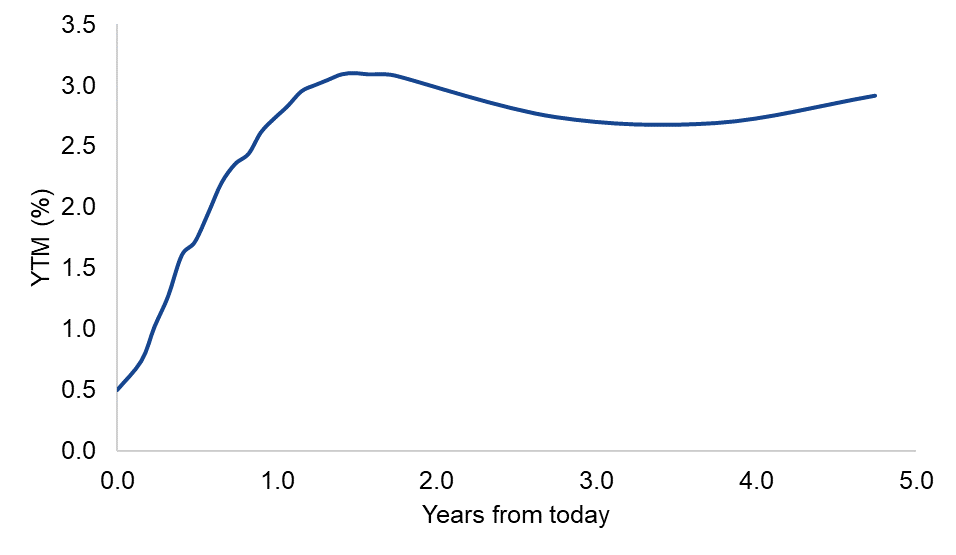
Source: Bloomberg
US consumer sentiment has stumbled to the lowest since 2011 amid a backdrop of high inflation and fallout of Russia invading Ukraine.
Chart 3 – University of Michigan Consumer Sentiment Index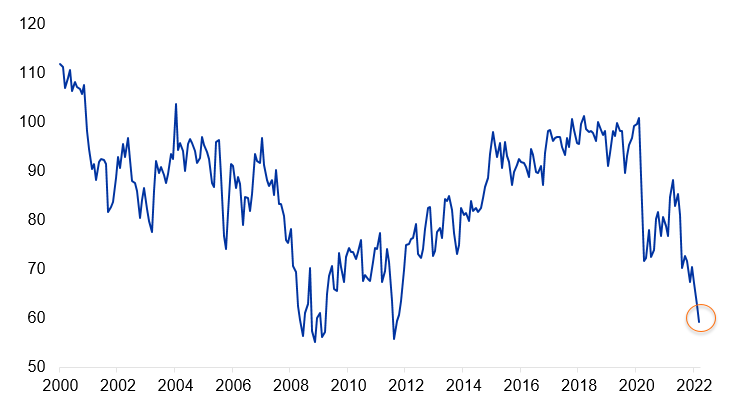
Source: Bloomberg
US businesses are also struggling with managing productivity levels as high input and wage costs weigh on margins. US manufacturing new orders retreated in March, a leading indicator for broader manufacturing activity.
Graph 4: Manufacturing New orders versus Activity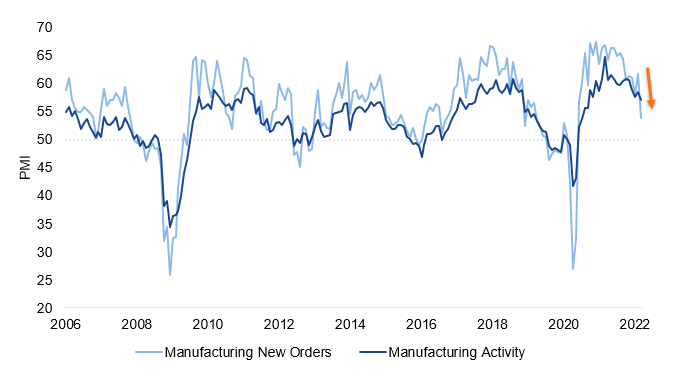
Source: ISM, Bloomberg. PMI above 50 indicates activity has expanded and visa versa. Inventory New Orders as ISM Manufacturing Report on Business New orders SA, Manufacturing Activity as ISM Manufacturing PMI SA.
Quality expected to outperform through volatility
If the US economy does fall into recession, and the global economy continues to stumble, quality companies would likely outperform, as they tend to offer investors protection during weaker economic environments and heightened market volatility. Indeed, history has persistently shown that in times of volatility, quality companies have outperformed, as they do during periods of economic slowdown and over the long term.
According to MSCI, world leading index provider, quality companies are those with: high return on equity (ROE), stable year-on-year earnings growth and low financial leverage. MSCI calculates quality indices that includes companies that score highly with those characteristics.
Chart 5 highlights that the MSCI quality index historically outperforms when manufacturing activity (proxy for economic activity) slows or contracts (orange or red).
Chart 5: US ISM Manufacturing PMI Index and MSCI World Quality versus MSCI World performance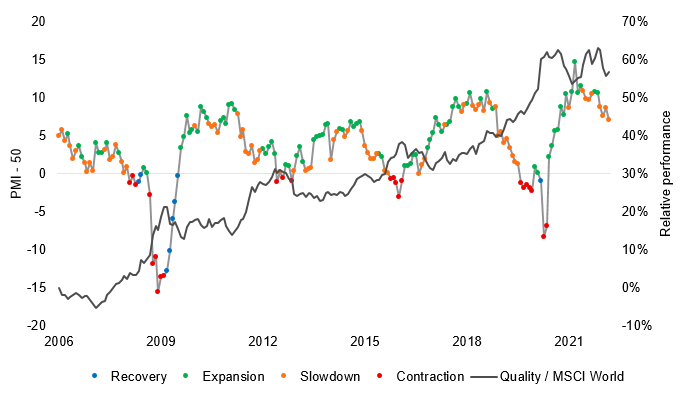
Source: ISM, Bloomberg, January 2006 to March 2022. Economic phase is a function on the current value of PMI-50 and the three-month change in PMI.
Option to hedge against rising Australian dollar
Another consideration for Australian investors is the Australian dollar, which has been rising. As a result, investors may want to hedge some of their offshore equity exposures to quality shares. Hedging can provide valuable protection against rises in the Australian dollar, which erode return from offshore investments once they are converted to local currency. Vice versa, when the Australian dollar falls, it may provide a benefit to an unhedged position.
QHAL and QUAL provide access to 20 developed countries and are overweight sectors such as defensive healthcare stocks and profitable technology companies which are underrepresented in Australia. QUAL is unhedged while QHAL is hedged.
In addition, the VanEck MSCI International Small Companies Quality ETF (QSML), which is an unhedged exposure to the world’s highest quality small companies based on MSCI’s quality fundamentals.
1 30 day December 2022 Federal fund futures as at 4 April 2022


Published: 11 April 2022
VanEck Investments Limited (ACN 146 596 116 AFSL 416755) (VanEck) is the issuer and responsible entity of all VanEck exchange trades funds (Funds) listed on the ASX. This is general advice only and does not take into account any person’s financial objectives, situation or needs. The product disclosure statement (PDS) and the target market determination (TMD) for all Funds are available at vaneck.com.au. You should consider whether or not an investment in any Fund is appropriate for you. Investments in a Fund involve risks associated with financial markets. These risks vary depending on a Fund’s investment objective. Refer to the applicable PDS and TMD for more details on risks. Investment returns and capital are not guaranteed.
QSML, QUAL and QHAL are indexed to a MSCI index. The funds are not sponsored, endorsed or promoted by MSCI, and MSCI bears no liability with respect to QSML, QUAL, QHAL or the MSCI Index. The PDSs contain a more detailed description of the limited relationship MSCI has with VanEck and the funds.
Related Insights