Five ETF ideas for ’25
With many uncertainties about 2025, we thought it would be prudent to consider where we think investors may find opportunities in the New Year.
It will be interesting to see how President Trump deals with his second term, when the RBA will cut and where bond yields will go. No one has a crystal ball (that works), but here are our five for ’25.
1 – Australian equities – smaller sized companies to shine - MVW | GMVW | MVS
Australia is at a different part of the economic cycle than many other developed markets. Our central bank has not yet started cutting rates.
While there has been a tendency in the recent past for equity investors to get excited by rate cuts, as the prevailing thought is that lower interest rates would be great for business, remember that rate cuts are normally in response to economic weakness. Thankfully, it looks like we’ll avoid a recession, and that has buoyed markets, particularly the bigger end of town - think about CBA’s share price, for example. Investors now must consider what happens next.
The chart below shows the price targets of Australian equity indices.
Chart 1: 12 month consensus price target return
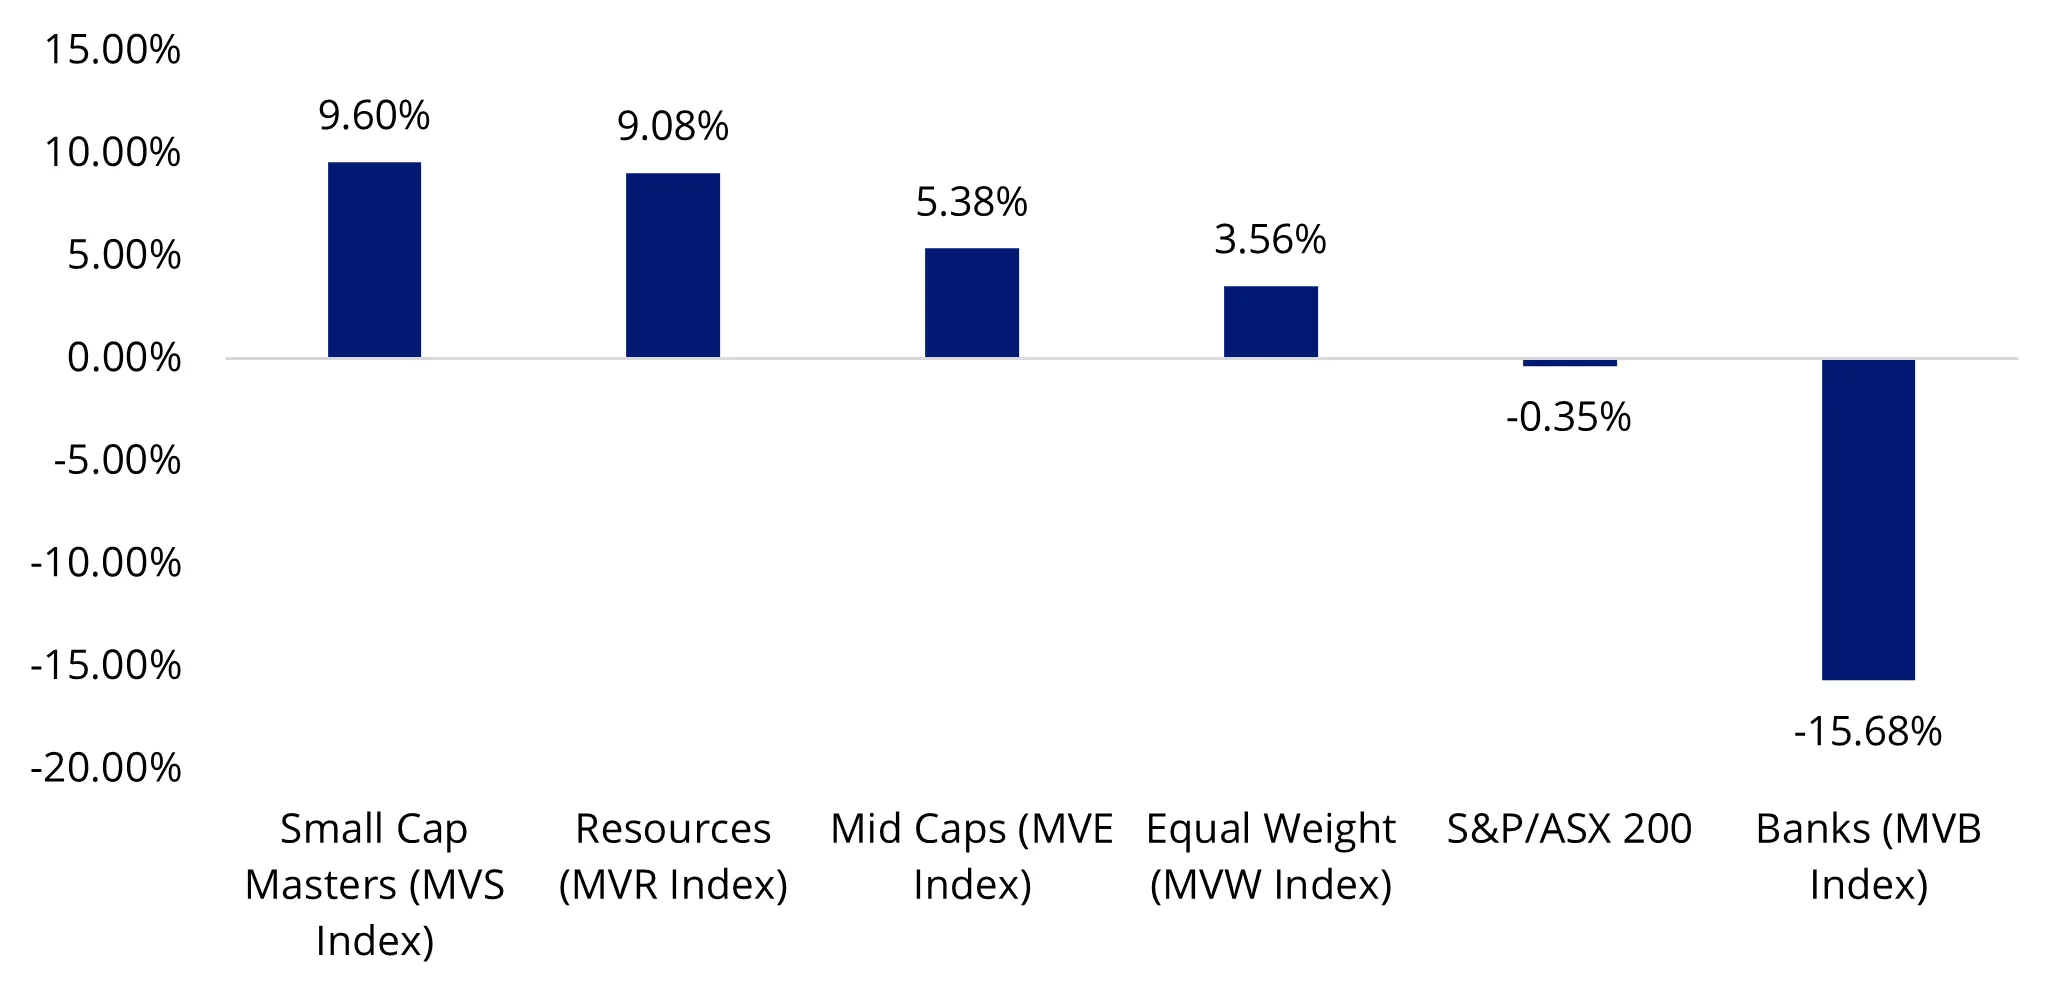
Source: Bloomberg, 30 November 2024, S&P/ASX indices. Price targets are not a guarantee of return and not a recommendation to act. MVS Index is MarketGrader Australia Small Cap 60 Index, MVR Index is MVIS Australia Resources Index, MVE Index is S&P/ASX Midcap 50 Index, MVW Index is MVIS Australia Equal Weight Index, S&P/ASX 200 is S&P/ASX 200 Index, MVB Index is MVIS Australia Banks Index. You cannot invest in an index.
What this means is that there could be opportunities in smaller companies.
By smaller, we use the term in its absolute sense. In Australian equities, we think there are opportunities outside the mega caps.
Most Australian equity portfolios benchmarked to the S&P/ASX 200 have minimal exposure to smaller-sized companies, as the largest mega-cap stocks dominate the index. The top 10 securities in the S&P/ASX 200 account for 49% of the weighting, and Commonwealth Bank alone now makes up more than 10%.
One way to allocate to small-sized companies, while retaining some exposure to the mega caps is the VanEck Australian Equal Weight ETF (MVW). MVW equally weights the largest and most liquid stocks on the ASX; at the last rebalance, no company was weighted more than 1.39%. Earlier this year we listed a geared version of MVW on the ASX, the VanEck Geared Australian Equal Weight Fund (Hedge Fund) (GMVW), which combines investors’ funds and borrowed funds to invest in MVW.
Looking at the Australian small caps sector, the S&P/ASX Small Ordinaries Index (Small Ords) has delivered lower cumulative returns relative to the broader large-cap-dominated S&P/ASX 200 index over the long term. The VanEck Small Companies Masters ETF (MVS) offers a way for investors to harness the size premium through a concentrated portfolio of small caps that are screened using a GARP (‘growth at a reasonable price’) lens. This portfolio is a low-cost, fully transparent alternative to active small company managers.
Read more here – Four small caps in Australia and globally with strong growth prospects
2 – Spotting a relative value opportunity set to benefit from the policy environment - QSML
In the same way Australian small companies present an opportunity, we think the same applies to global small companies.
The global equity market rally over the last few years has had the greatest impact on large cap valuations. In the same way CBA’s share price has rocketed up, the ‘Magnificent 7’ have experienced significant growth.
This has meant that global small caps, relative to global large caps, remain as cheap as they have been in the past decade. At this stage of the cycle, in the past, small-caps have offered more upside than large caps because they have underperformed large-caps during the during the preceding period of economic weakness.
While many global economies’ central banks have already started cutting in response to this weakness, we think global small caps may represent a compelling relative value opportunity. In addition, President Trump’s pro-business policies may benefit small companies.
Chart 2: Global small companies look cheap based on fundamentals
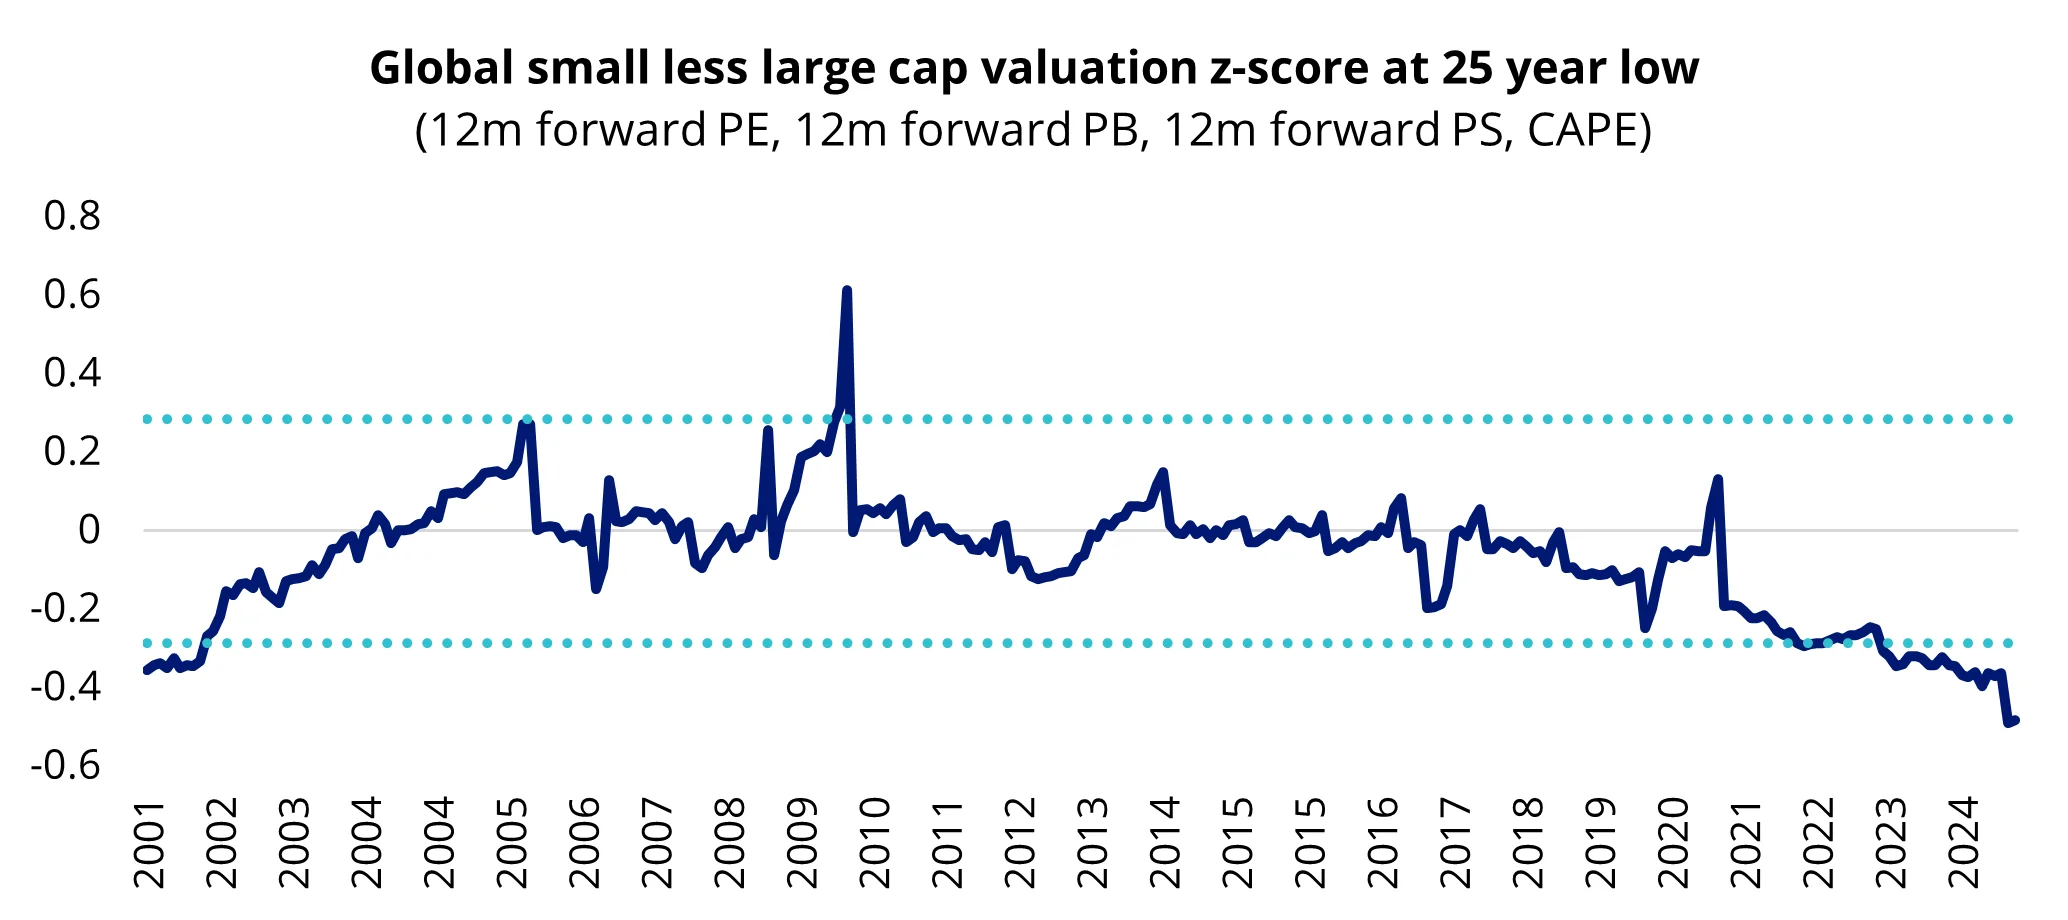
Source: Bloomberg as at 30 November 2024, Z-score quantifies how many standard deviations valuations are different to the historical average. The graph above shows the average z-score by 12 month forward price to earnings, 12 month forward price to book, 12 month forward price to sales. Latest value is 2 standard deviations above the historical average. Global small represented MSCI World Small Cap Index, large cap represents MSCI World Index.
However, it pays to be prudent when it comes to global small companies investing. The reality is that many of these companies are not making money. The international small companies benchmark, which includes more than 4,000 companies, captures many companies that are not attractive from an investment point of view. The Quality Factor, inspired by investment pioneers such as Benjamin Graham and Warren Buffett, focuses on return on equity and balance sheet strength. This approach has shown historical outperformance in the mid- and large-cap universe, and our back testing displays long-term outperformance against the parent small cap index. The VanEck MSCI International Small Companies Quality ETF (QSML) is the only smart beta international small-cap ETF in Australia, and includes companies on the basis of high return on equity, stable year-on-year earnings growth, and low financial leverage.
Read more here – How to find quality global small cap stocks
3 – Adding in duration ahead of rate cuts and seeking higher yields – XGOV/LEND
We think there could now be opportunities for fixed-rate bond investors, especially in duration, as the likelihood of yields decreasing appears stronger than the chance of them increasing. The broker consensus is for Australian government 10-year yields to edge lower over the next 24 months, as the RBA moves closer to an easing cycle.
Investors with longer-term fixed rate bonds could experience the greatest returns as yields fall. Looking back at the last five rate cuts, three months before the first rate cut appears to be the sweet spot for maximising returns with yields falling the most and long-dated bonds experiencing the most upside.
Chart 3: Australian government bond performance around the first rate cut
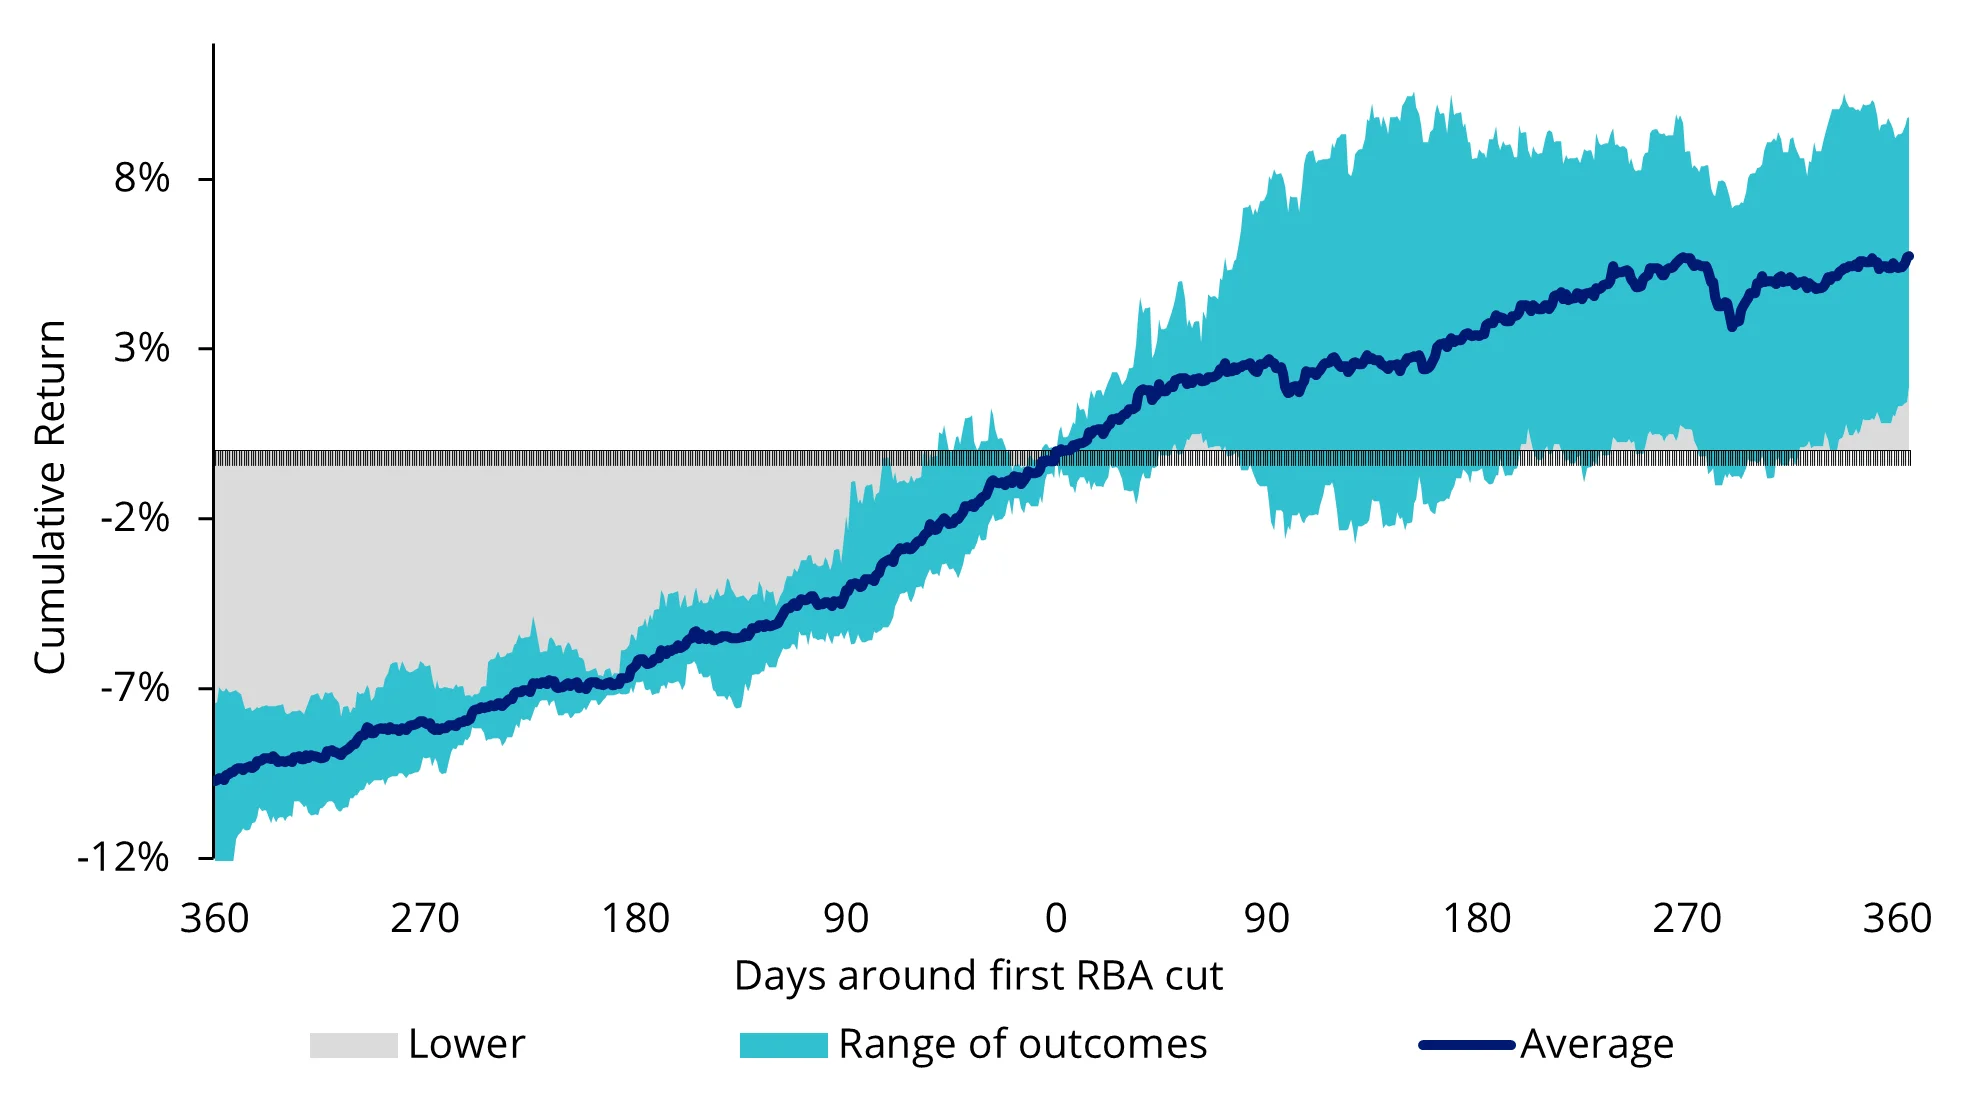
Chart 4: 12 month forward return around first RBA rate cut
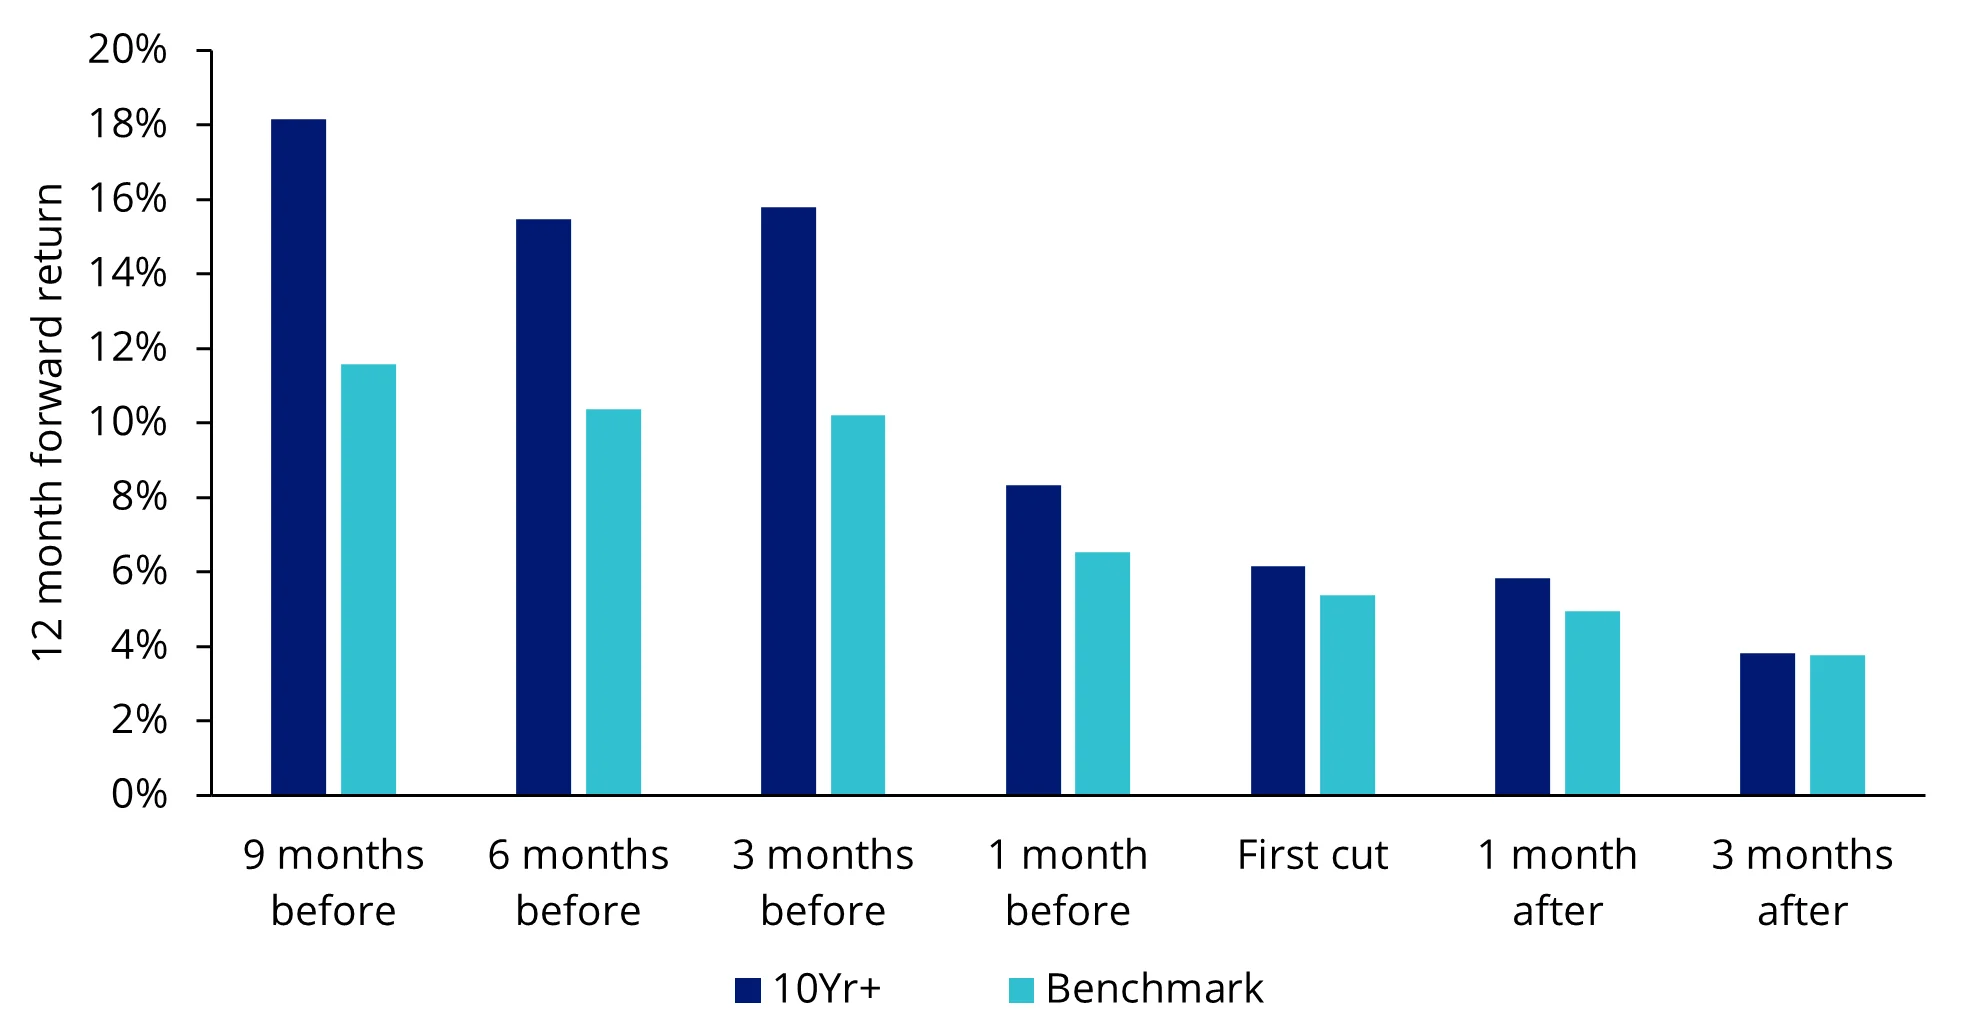
Chart 3 and 4 source: Bloomberg, Benchmark as S&P/ASX Government Bond Index, 10Yr+ as S&P/ASX Government Bond 10Yr+ Index. Rate cuts include 6 February 2001, 2 September 2008, 1 November 2011, 3 February 2015 and 4 June 2019.
The VanEck 10+ Year Australian Government Bond ETF (XGOV) invests in a portfolio of Australia dollar-denominated Australian Government Bonds with maturity dates between 10 and 20 years.
Those seeking higher yields may wish to consider private credit. The VanEck Global Listed Private Credit (AUD Hedged) ETF (LEND) offers a diversified portfolio of globally listed private credit companies, known as Business Development Companies (BDCs), that are based in the United States. These BDCs are often run by the biggest names in private credit, such as Blackstone, Blue Owl and Goldman Sachs. BDCs are legally required to distribute at least 90% of their net investment income to shareholders, which is why they are known for their substantial yield premium to other asset classes.
Read more here - What is the yield curve and why it matters for investors
4 – Managing risk against potential for exogenous shocks – NUGG / GDX
This year, gold has been one of the top-performing commodities, surging over 30%. However, this has largely been driven by investors and central banks in emerging markets. Since 2022, investor demand in developed markets for gold bullion ETFs has been on the decline. When they come back – and we think they will – the rally in the gold price could re-accelerate, and this demand will drive the next leg of this bull market.
We believe the price of gold continues to be supported by both the US and global macro landscape. Expectations of inflationary policies under the new US administration, heightened global geopolitical risk, combined with strong central bank net buying, the US debt outlook and further rate cuts by the Fed, suggest potential upward momentum for gold in the longer term.
Chart 5: US government debt at all time high and forecast to increase
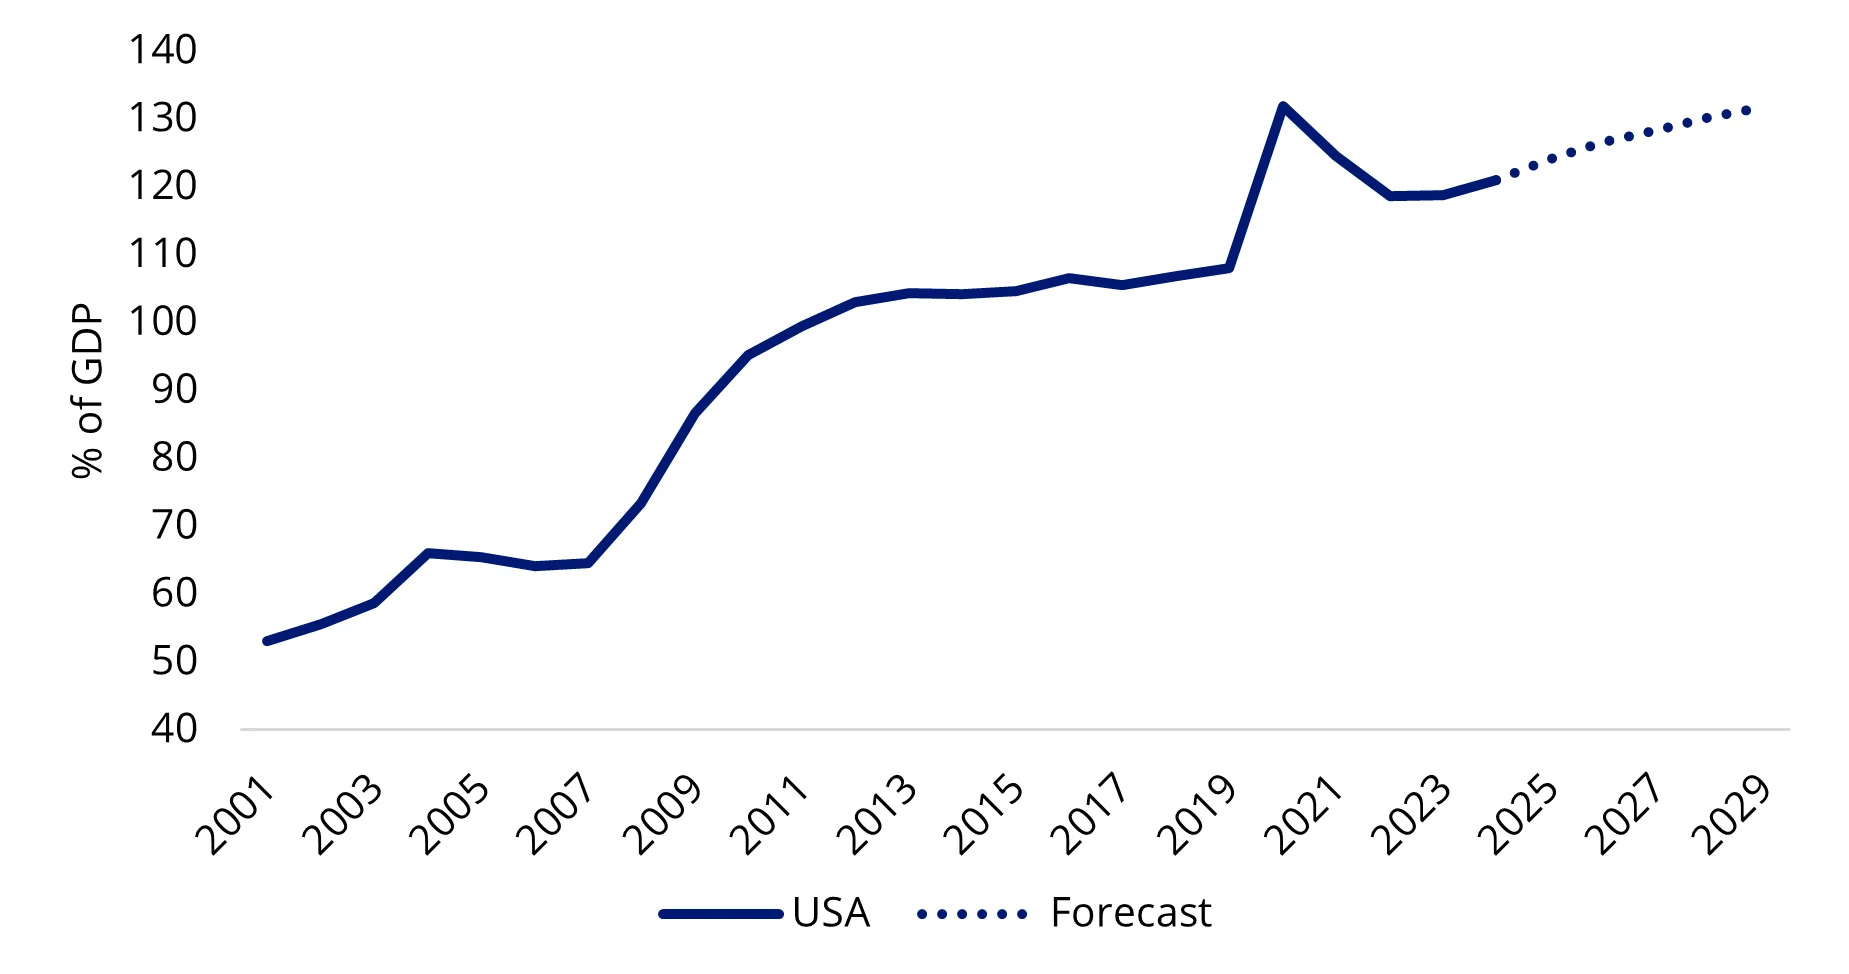
Source: IMF, Bloomberg.
The VanEck Gold Bullion ETF (NUGG) is backed by physical Australian origin gold bullion bars, which are held by The Perth Mint, and can be redeemed for physical gold bullion.
Investors looking to hedge broader market risk through gold exposure, we think should also consider an allocation to the gold mining sector via the VanEck Gold Miners ETF (GDX). The price of gold miners typically rises more than the increase in gold prices, as miners will add their own margins to gold production. Gold equities have lagged the return of the gold price this year, which is surprising. As a result, we think they present a compelling value opportunity. Currently, the gold mining sector benefits from robust cash flow generation and disciplined capital allocation strategies, yet it remains undervalued compared to historical averages.
Read more here – The investment opportunities with gold and gold equities
5 – Paying attention to an asset class supported by structural tailwinds - GPEQ
Listed private equity has been one of the quiet achievers this year, yet it is still trading at a discount to the net asset value (NAV) of its underlying assets.
Index provider, LPX has analysed the returns of its index since 1993 to the end of 2023. The empirical results suggest that in 81% of all years since 1993, listed private equity has outperformed public markets when a discount was observed at the end of the year. GPEQ started the year trading at a discount and has had a strong 2024. Short of a significant rally, it is likely that global listed private equity will also finish 2024 with a discount too. However as we always mention, past performance is not indicative of future results.
Activity in private equity began heating up again in 2024 as inflation started to fall and interest rates normalised. As we near the end of 2024, a review of private markets’ data shows private equity appears to have reverted to pre-COVID levels in terms of fundraising, investment activity and deals. The asset class’s returns, as reflected by listed private equity, reflect these dynamics, and there are many reasons the momentum could continue into 2025.The VanEck Global Listed Private Equity ETF (GPEQ), which is the only listed private equity ETF on the ASX, has been reflecting this positive activity, returning 43.97% for the 12 months to 13 November 2024 (we would always caution that past performance should not be relied upon for future performance).
GPEQ provides immediate access to a highly diversified group of the 50 largest/most liquid listed private equity companies, with a collective private equity portfolio of more than 3,300 private equity direct investments and 350 private funds.
Read more here – Listed private equity is one of the best performers for 2024
Key Risks: An investment in any of the funds carries risks associated with: ASX trading time differences, financial markets generally, individual company management, industry sectors, foreign currency, country or sector concentration, hedging, political, regulatory and tax risks, fund operations and tracking an index. While it is not possible to identify every risk relevant to your investment, we have provided details of the risks that may affect an investment in the relevant product disclosure statement.
Published: 13 December 2024
Any views expressed are opinions of the author at the time of writing and is not a recommendation to act.
VanEck Investments Limited (ACN 146 596 116 AFSL 416755) (VanEck) is the issuer and responsible entity of all VanEck exchange traded funds (Funds) trading on the ASX. This information is general in nature and not personal advice, it does not take into account any person’s financial objectives, situation or needs. The product disclosure statement (PDS) and the target market determination (TMD) for all Funds are available at vaneck.com.au. You should consider whether or not an investment in any Fund is appropriate for you. Investments in a Fund involve risks associated with financial markets. These risks vary depending on a Fund’s investment objective. Refer to the applicable PDS and TMD for more details on risks. Investment returns and capital are not guaranteed.
MVIS Australia Equal Weight Index (‘MVIS Index’) is the exclusive property of MV Index Solutions GmbH based in Frankfurt, Germany (‘MVIS’). MVIS is a related entity of VanEck. MVIS makes no representation regarding the advisability of investing in the Fund. MVIS has contracted with Solactive AG to maintain and calculate the MVIS Index. Solactive uses its best efforts to ensure that the MVIS Index is calculated correctly. Irrespective of its obligations towards MVIS, Solactive has no obligation to point out errors in the MVIS Index to third parties.
The S&P/ASX MidCap Index (the Index”) is a product of S&P Dow Jones Indices LLC or its affiliates (“SPDJI”) and ASX Limited (“ASX”) and licensed for use by VanEck. S&P® is a registered trademark of Standard & Poor’s Financial Services LLC (“S&P”); Dow Jones® is a registered trademark of Dow Jones Trademark Holdings LLC (“Dow Jones”); and these trademarks have been licensed for use by SPDJI and sublicensed by VanEck. The Fund is not sponsored, endorsed, sold or promoted by SPDJI, Dow Jones, S&P, their respective affiliates, or ASX and none of them makes any representation regarding the advisability of investing in the Fund. Such parties do not accept liability for any errors, omissions, or interruptions of the Index and do not give any assurance that the Fund will accurately track the performance of the index or provide positive investment returns. Inclusion of a security within the index or Fund is not a recommendation by any party to buy, sell, or hold such security.
MVIS Australia Banks Index (‘MVIS Banks Index’) is the exclusive property of MV Index Solutions GmbH based in Frankfurt, Germany (‘MVIS’). MVIS is a related entity of VanEck. MVIS makes no representation regarding the advisability of investing in the Fund. MVIS has contracted with Solactive AG to maintain and calculate the MVIS Banks Index. Solactive uses its best efforts to ensure that the MVIS Bank Index is calculated correctly. Irrespective of its obligations towards MVIS, Solactive has no obligation to point out errors in the MVIS Bank Index to third parties.


