Getting in the game
The video gaming industry is earning billions in annual revenues and we believe there is more to come. In addition to console games, the growth of online virtual worlds, rapidly accelerated by COVID-19, has led to a flurry of attention and activity around what is commonly referred as the metaverse.
Coming into the end of the year, video gaming companies have lined up a number of releases, among them Halo: Infinite and Final Fantasy XVI, this is on the back of the successful release of Call of Duty: Vanguard.
The video gaming industry is earning billions in annual revenues and we believe there is more to come. In addition to console games, the growth of online virtual worlds, rapidly accelerated by COVID-19, has led to a flurry of attention and activity around what is commonly referred as the metaverse.
The metaverse is a virtual-reality space in which users can interact with a computer-generated environment and other users. Video gaming related stocks such as Nvidia and Roblox, recently made headlines for their impressive corporate performances following metaverse advancements and impressive Q3 earnings.
The video gaming industry is also supported by long-term trends such as demographic shifts and changing consumer demands, boosting its attractiveness.
Video game industry and the metaverse
The video game industry is earning billions in annual revenues and reaching billions of consumers around the world. In 2020, the total video game industry reached US$177 billion in revenues, making it a bigger industry than both cyber-security and robotics1. By 2023, over three billion people around the world are expected to play video games in some form.
The growth of online virtual worlds, rapidly accelerated by COVID-19, has led to a flurry of attention and activity around what is commonly referred as the metaverse. The metaverse is a virtual-reality space in which users can interact with a computer-generated environment and other users. According to analytics and market research company Newzoo, the metaverse is powerful enough to persist beyond the pandemic’s end and has a vital part to play in gaming’s future2.
Examples of video gaming related stocks that have benefited from metaverse advancements are Nvidia Corporation and Roblox Corporation. Nvidia recently rose over 8% in a day following metaverse advancements and impressive Q3 earnings (Chart 1). The company’s quarterly revenue jumped 50% year-over-year on the back of strong performances by its data centre and gaming businesses in Q33. The company also debuted its new hardware and software related to its metaverse platform called Omniverse, its self-driving vehicle initiatives, and its artificial intelligence work.
Roblox traded on high territory amid investor enthusiasm for its position as a leader in the emerging metaverse (Chart 2). The company reported better-than-expected Q3 earnings4.
Our Video Gaming and Esports ETF (ESPO) holds both stocks in its top ten holdings.
Chart 1: Nvidia’s price soars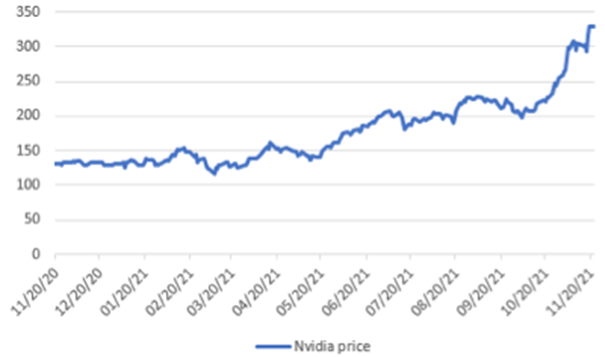
Source: Factset. Data as of 22 November 2021. Past performance is not a reliable indicator of future performance.
Chart 2: Roblox’s price on high territory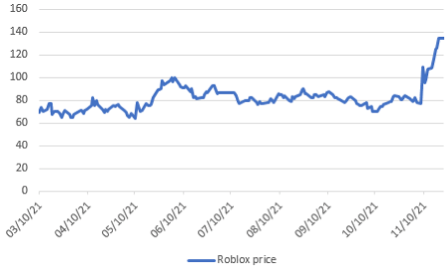
Source: Factset. Data as of 22 November 2021. Past performance is not a reliable indicator of future performance
Long-term supportive trends of the video game industry
The video game industry represents a long-term structural growth story (Chart 3), supported by broader trends which include demographic shifts, change in consumer preferences and the widening of monetisation avenues through subscription and free-to-play models. The current average gamer is between 28 to 32 years old, well-educated, earns more than the average consumer, and is willing to spend on video games and related activities.
These demographics are replicated across the world, particularly in populous emerging market countries. Consumer preferences have also shifted to desire more interaction. Mixing social media and gaming allows them to bring their friends into the interactive online world. Additionally, games are increasingly moving towards a subscription model, much like Netflix. Such a model provides a more reliable path to monetisation for smaller, quality games that may otherwise lack the marketing or monetisation to break into the mainstream. These trends support the long-term structural growth of the industry, reiterating its potential for investors.
Chart 3: Growing revenues and user base

Source: Newzoo Global Games Market Report, 2016, 2017, 2018, 2019, 2020, 2021. Past performance is not indicative of future results; current data may differ from data quoted.
* Projected by Newzoo.
Stellar fund performance and diversification from FAANGM stocks
Investors have limited exposure to this sector because esports and video game companies make up only 6.14% of the NASDAQ 100 and only 5.59% of MSCI’s Information Technology sector.
Chart 4: Exposure to video gaming and esports
Video game and esport exposure in the NASDAQ 100:
- Acitivision Blizzard (0.41%)
- Advanced Micro Devices (0.98%)
- Electronic Arts (0.27%)
- Netease Inc (0.20%)
- NVIDIA Corp (4.29%)
Video game and esport exposure in the MSCI World Technology Index:
- Advanced Micro Devices (0.94%)
- NVIDIA Corp (2.75%)
- Unity Software (0.06%)
Source: FactSet, as at 31 October 2021
This makes the video gaming sector an attractive diversifier to the FAANGM giants, Facebook (now Meta), Amazon, Apple, Netflix, Microsoft and Google owner, Alphabet. While FAANGMs, as they were known, powered the returns of the S&P 500 and NASDAQ in recent years, recent volatility, concerns around corporate performance and the evolving regulatory environment have stoked fears that their momentum could falter.
ESPO has benefitted from the industry’s strong run (Chart 5). We believe the uptick in video gaming and esports in the wake of COVID-19 shows no signs of slowing. Since we launched ESPO in September 2020, it has returned 22.17% p.a. (to 24 November 2021)
Video game companies have been benefiting from unprecedented growth for a number of years. Based on modelled back-testing after fees, the video game sector, as represented by the MVIS Global Video Gaming & eSports Index (ESPO Index net of management cost) has outpaced the broader global equity market and the tech-heavy NASDAQ 100 index over the past five years.
Chart 5: Modelled cumulative performance: ESPO Index after fees1vs major global indices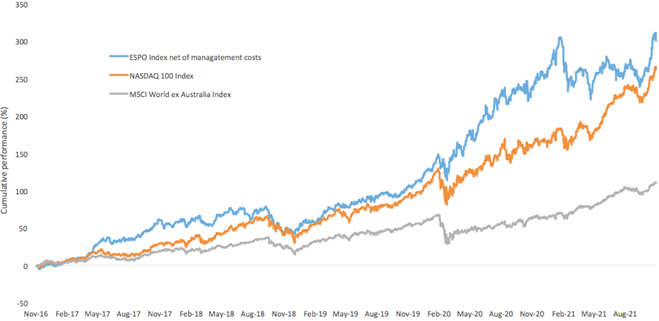
Table 1: Trailing returns: ESPO, ESPO Index after fees1
|
1 month |
3 months |
6 months |
YTD |
1 Year |
Since ESPO Inception2(% p.a.) |
3 Years |
5 Years |
Since ESPO Index base date3 |
|
|
ESPO |
10.30 |
9.06 |
15.38 |
13.77 |
20.14 |
22.17 |
|
|
|
|
ESPO Index (net of management cost)1 |
|
|
|
|
|
|
40.77 |
32.13 |
35.07 |
Chart 5 and Table 1 Source: VanEck, Morningstar, Bloomberg as at 24 November 2021. Past performance is not a reliable indicator of future performance. The comparison in chart 1 to the MSCI World ex Australia Index (“MSCI World ex Aus”) and the NASDAQ 100 is shown for illustrative purposes only, as they are widely recognised benchmarks international and technology benchmarks. ESPO’s index measures the performance of companies involved in video game development, eSports, and related hardware and software globally. ‘Click here for more details’.
1ESPO Index results are net of ESPO’s 0.55% p.a. management costs, calculated daily but do not include brokerage costs or buy/sell spreads of investing in ESPO. You cannot invest in an index.
2ESPO inception date is 8 September 2020 and a copy of the factsheet is here.
3ESPO’s Index base date is 31 December 2014. ESPO Index performance prior to its launch in August 2020 is simulated based on the current index methodology.
Valuations
When compared against the NASDAQ 100, ESPO exhibits favourable historical Earnings per Share (EPS) Growth and Sales Growth as well as notably cheaper valuations. The fund’s Price/Earnings (P/E) ratio of about 30 times is lower than the NASDAQ’s 34 times. It also has a lower Price to Book (P/B). Considering ESPO against the FAANGMs, ESPO is cheaper, while also retaining its favourable growth characteristics.
Table 2: ESPO fundamentals
|
Fundamentals |
NASDAQ 100 |
FAANGM's |
ESPO |
|
3Yr EPS Growth (%) |
31.9 |
47.9 |
48.4 |
|
3Yr Sales Growth (%) |
17.3 |
21.5 |
26.3 |
|
Price to Earnings (P/E) (x) |
33.9 |
41.4 |
30.0 |
|
Price to Book (P/B) (x) |
9.18 |
17.98 |
5.55 |
|
Price to Sales (P/S) (x) |
6.43 |
10.33 |
6.85 |
|
Market Capitalisation (A$m) |
1,487,887 |
2,344,806 |
242,155 |
ESPO’s index measures the performance of companies involved in video game development, eSports, and related hardware and software globally. Click here for more details. MVIS Global Video Gaming & eSports Index results are net of ESPO’s 0.55% p.a. management costs, calculated daily but do not include brokerage costs or buy/sell spreads of investing in ESPO. You cannot invest in an index.
1 Newzoo
2 Global Games Market Report 2021
3 https://finance.yahoo.com/news/nvidia-stock-soars-after-blowout-earnings-metaverse-advances-151833818.html
4 https://www.investors.com/news/technology/roblox-stock-continues-meteoric-rise-on-metaverse-story


Published: 29 November 2021
VanEck Investments Limited (ACN 146 596 116 AFSL 416755) (‘VanEck’) is the issuer and responsible entity of all VanEck exchange trades funds (Funds) listed on the ASX. This is general advice only and does not take into account any person’s financial objectives, situation or needs. The product disclosure statement (PDS) and the target market determination (TMD) for all Funds are available at vaneck.com.au. You should consider whether or not an investment in any Fund is appropriate for you. Investments in a Fund involve risks associated with financial markets. These risks vary depending on a Fund’s investment objective. Refer to the applicable PDS and TMD for more details on risks. Investment returns and capital are not guaranteed.
MVIS Global Video Gaming and eSports Index (AUD) (‘MVIS Index’) is the exclusive property of MV Index Solutions GmbH based in Frankfurt, Germany (‘MVIS’). MVIS is a related entity of VanEck. MVIS makes no representation regarding the advisability of investing in the Fund. MVIS has contracted with Solactive AG to maintain and calculate the MVIS Index. Solactive uses its best efforts to ensure that the MVIS Index is calculated correctly. Irrespective of its obligations towards MVIS, Solactive has no obligation to point out errors in the MVIS Index to third parties.