Oils ain’t oils and hydrogen ain’t hydrogen
You may be aware that one of the so-called clean energy supplies of the future is hydrogen. It is being touted as a clean energy solution. However, it’s worth understanding that the production of hydrogen can result in carbon emissions, or CO2 and it isn’t necessarily as clean you might think.
You may be aware that one of the so-called clean energy supplies of the future is hydrogen. It is being touted as a clean energy solution. However, it’s worth understanding that the production of hydrogen can result in carbon emissions, or CO2 and it isn’t necessarily as clean you might think.
Hydrogen is the most common element on the planet and it makes up over 95% of the universe. But it is rare to find hydrogen in its purest form, which is an odourless but flammable gaseous substance. Hydrogen is usually an element of some other substance such as water or gas. This base determines carbon emissions.
Australia’s Andrew ‘Twiggy’ Forrest has been a vocal advocate for ‘green hydrogen’, that is, hydrogen fuel production that does not emit CO2. The base for ‘green hydrogen’ is water, as opposed to steam methane reforming, as the cleanest hydrogen production comes from water.
As the world transitions to infinite clean energy away from fossil fuels, it’s important for investors to have exposure to a diversified portfolio that invests in a variety of clean energy producers and technology and equipment businesses supplying the sector. With investors mindful of the global commitment to Zero Net Carbon, an exchange traded fund (ETF) focused on the broader clean energy sector can deliver exposure to companies involved in producing green hydrogen, along with other key renewable energy businesses which are all benefiting from huge investment.
Reflecting that growth and strong capital returns, the S&P Global Clean Energy Index has delivered a one-year total return of 48.6% as of 30 July 20211. Therefore, having a diversified investment perspective is important to spread your risks.
The rise of hydrogen
Like electricity, hydrogen (H2), delivers energy in an easily usable form that can be transported. Central H2 production plants can produce energy for transportation to the point of end use. Liquid hydrogen is the most cost-effective form of hydrogen to transport.
In North America today, more than 95% of hydrogen is produced by large-scale steam methane reforming (SMR). This is the most cost-effective method of hydrogen production, but it also results in a by-product: CO2.
During VanEck’s recent Visionaries and Innovators with the Hon Malcolm Turnbull, he discussed different methods for hydrogen energy production including Andrew ‘Twiggy’ Forrest’s push for ‘clean’ hydrogen; “oils ain’t oils and hydrogen ain’t hydrogen” he said. It highlights the importance of understanding the ‘clean energy’ complex.
As table 1 shows, the “cleanest” hydrogen production comes from water.
Table 1: Major hydrogen production processes
|
METHOD |
PROCESS |
SUBSTANCE |
ENERGY |
CO2 EMISSIONS |
LOCATION |
|
Thermal
|
Steam reformation |
Natural Gas |
High temperature steam |
Yes |
Central or Distributed |
|
Thermochemical water splitting |
Water |
High temperature heat from advanced gas-cooled nuclear reactors |
Zero |
Central |
|
|
Gasification |
Coal and biomass |
Steam and oxygen at high temperature and pressure |
Yes |
Central |
|
|
Pyrolysis |
Biomass |
Moderately high temperature steam |
Yes |
Central |
|
|
Electrochemical
|
Electrolysis |
Water |
Electricity from wind, solar, hydro and nuclear |
Zero |
Central or Distributed |
|
Electrolysis |
Water |
Electricity from coal or natural gas |
Yes |
Central or Distributed |
|
|
Photoelectrochemical |
Water |
Direct sunlight |
Zero |
Central |
|
|
Biological |
In exploratory R&D phase |
|
|
|
|
Source: National Hydrogen Association, Ballard.
Beyond hydrogen and the entire clean energy complex
The transition to clean energy is well underway. Already, renewable electricity costs have fallen sharply, driven by improving technologies, economies of scale, increasingly competitive supply chains and growing developer experience. Renewable energy capacity is being added at lower costs than the cheapest new coal plants. The grey band that crosses the entire of figure 1 represents the fossil fuel-fired power generation cost range.
Figure 1: The global weighted-average levelised cost of electricity (LCOE) and power purchase agreements / auction prices for solar PV, onshore wind, offshore wind and CSP, 2010-2023
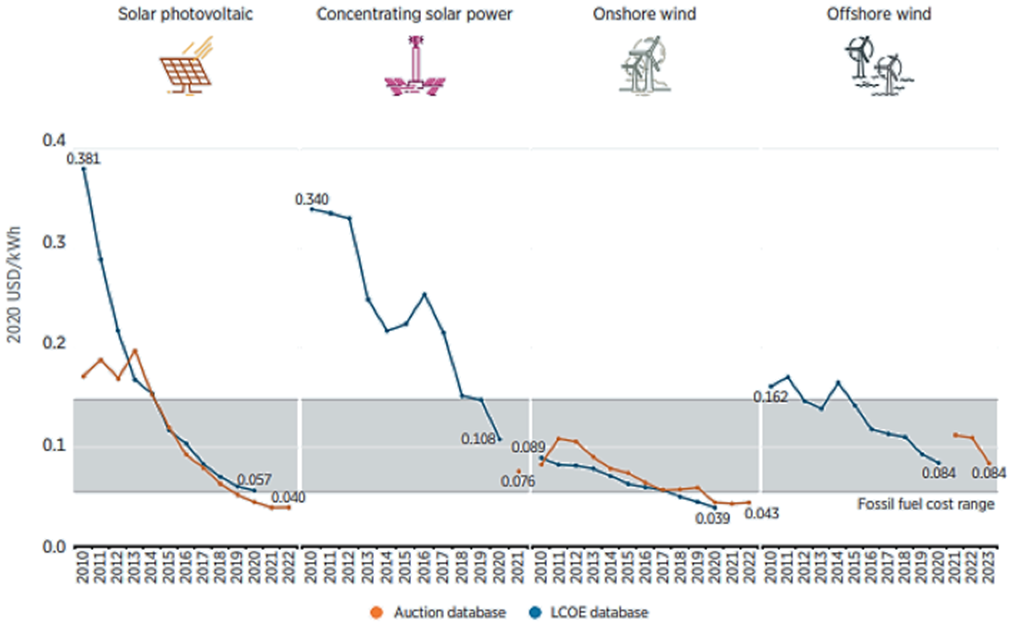
Source: International Renewable Energy Agency, Renewable Costs database for 2020. The LCOE data is the global weighted-average LCOE value derived from the individual plants commissioned in each year. The band that crosses the entire chart represents the fossil fuel-fired power generation cost range.
As shown in Figure 2 below, almost three-quarters of CO2 emissions come from energy use, almost one-fifth from agriculture and land use, and the remaining 8% is from industry and waste.
Figure 2: Global greenhouse gas emissions by sector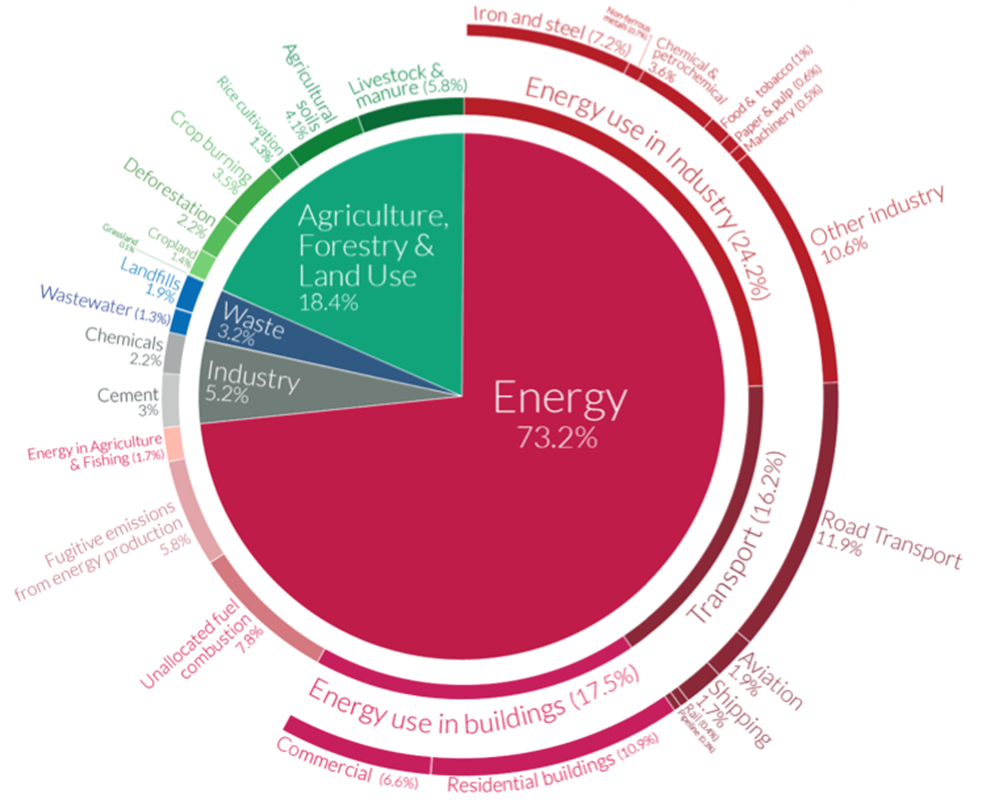
Source: Climate Watch, the World Resources Institute (2020) and Sector by sector: where do global greenhouse gas emissions come from? by H. Ritchie, 18 September 2020 via ourworldindata.org. Note: This chart shows the breakdown of global greenhouse gas emissions in 2016. This is the latest breakdown of global emissions by sector, published by Climate Watch and the World Resources Institute.
Unequivocally, the burning of fossil fuels for energy produces the lion’s share of carbon emissions and is the driving force of climate change.
This is why most, if not all, government climate policies around the world are focused on energy as the primary vehicle to reduce carbon emissions; while funding and investments are being directed to clean energy producers, and clean technology and equipment that enables us to transition away from burning fossil fuels.
As costs continue to come down and with oil and coal production passing peak production, more and more energy production will be from growing clean energy producers, using clean energy technologies and equipment.
Learn more about investing in clean energy.


Published: 02 September 2021
IMPORTANT NOTICE
VanEck Investments Limited ACN 146 596 116 AFSL 416755 (‘VanEck’) is the responsible entity and issuer of units in the VanEck Global Clean Energy ETF (CLNE). Nothing in this content is a solicitation to buy or an offer to sell shares of any investment in any jurisdiction including where the offer or solicitation would be unlawful under the securities laws of such jurisdiction. This is general advice only, not personal financial advice. The PDS is available here. An investment in CLNE carries risks associated with: ASX trading time differences, financial markets generally, individual company management, industry sectors, foreign currency, emerging markets, country or sector concentration, political, regulatory and tax risks, fund operations, liquidity and tracking an index. See the PDS for details. No member of the VanEck group of companies guarantees the repayment of capital, the payment of income, performance, or any particular rate of return from any fund.