Healthcare under the microscope
One sector that has received a lot of attention from investors during the COVID pandemic has been healthcare. The problem for ASX investors is that opportunities are limited. The local sector is relatively small and is dominated by CSL, therefore an allocation to global healthcare is an important diversifier. We provide some insightful analysis of our popular of VanEck Global Healthcare Leaders ETF (HLTH) and the global healthcare benchmark.
Australian investors are generally underweight healthcare stocks relative to international benchmarks. The local sector is relatively small and is dominated by CSL, therefore an allocation to global healthcare is an important diversifier. In terms of long-term returns, the performance of global healthcare has been very attractive. Only the technology sector has performed better since 2008. But the ability for Australians to access the opportunity to invest in global healthcare has been limited.
One of the most popular ways Australian investors access a dedicated global healthcare strategy is via a passive fund tracking the benchmark index, the S&P Global 1200 Healthcare Sector Index.
Innovations in index design for passive funds are delivering above market benchmark returns over the long term while retaining low costs. It is this approach that VanEck offers which is being used by savvy investors as a way to invest in global equities.
Taking a market capitalisation approach to global healthcare leaves investors with a long tail and potential concentration risks. Active managers make bets on who they think might be tomorrow’s winners based on complex and risky factors such as drug trials, novel science and winning regulatory approvals. We believe a smart beta, or rules-based approach, that targets companies that consistently deliver growth has the potential to deliver greater rewards to investors over the longer term.
Smart beta combines the best of active and passive management. The best of active, in that it can reward investors over the long term and the best of passive in that it is low cost. VanEck Global Healthcare Leaders ETF (HLTH) is the most cost effective dedicated global healthcare strategy available to Australian investors.
HLTH’s ‘smarter’ approach
HLTH tracks the MarketGrader Developed Markets (ex-Australia) Health Care Index, which targets stocks that deliver growth at a reasonable price (GARP) and generate long-term shareholder value. Companies are selected on the basis of the strength of 24 fundamental indicators across four factor categories:
-
- Growth;
- Value;
- Profitability; and
- Cash flow.
The HLTH Index identifies the top 100 companies with the best GARP attributes, selects only the top 50 by market capitalisation, then equally weights the constituents. The result is a portfolio of 50 fundamentally sound and attractively valued companies with the best growth prospects in the healthcare sector.
So let’s walk through the difference between HLTH and the S&P Global 1200 Healthcare Sector Index.
HLTH vs S&P Global 1200 Healthcare Sector Index - Top 10 holdings
Below you can see the top 10 companies. In S&P Global 1200 Healthcare Sector Index one company, Johnson & Johnson makes up 6.32% of the index, its top ten is over a third of the index. What this means is that there are many, smaller sized Healthcare companies that do not contribute much to portfolio performance of the S&P Global 1200 Healthcare Sector Index compared to their impact in HLTH. In addition, their only criteria for inclusion, apart from being a healthcare company, is being big enough. Big is not always better. To see all the holdings in HLTH and their weightings click here.
Table 1: Top 10 holdings HLTH Table 2: Top 10 holdings S&P Global
1200 Healthcare Sector Index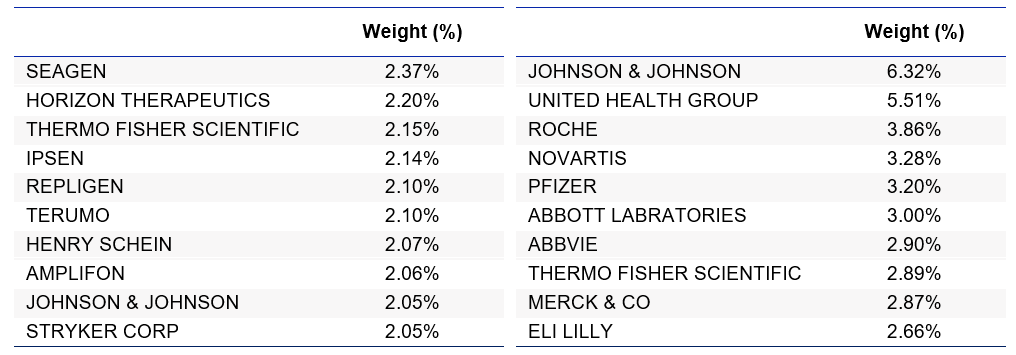
Source: VanEck, S&P, as at 30 September 2021
HLTH vs S&P Global 1200 Healthcare Sector Index – Fundamentals
Table 3: Statistics and fundamentals
As you would expect, HLTH has higher ROE and a higher EPS growth rate because of the growth part of its GARP methodology. The other aspect is GARP is ‘at a reasonable price’, and you can see HLTH is also more attractive on a price to earnings perspective.
|
|
HLTH |
S&P Global 1200 Healthcare Sector Index |
|
Index strategy |
Smart beta |
Market capitalisation weight |
|
Return on equity (ROE) % |
20.32 |
19.53 |
|
Long term debt to capital % |
25.97 |
37.32 |
|
Historic 3 year earnings per share growth % |
35.8 |
27.3 |
|
Historic 3 year sales growth % |
11.9 |
8.6 |
|
Price to Earnings (P/E) |
20.9 |
26.9 |
|
Weighted average market capitalisation ($m)
|
28,162 |
90,638 |
HLTH vs S&P Global 1200 Healthcare Sector Index - Style
When looking at portfolios it is important to determine what style (e.g. value or growth) and what size bias a portfolio holds (e.g. giant, large, mid or small). Below we can see HLTH’s. Importantly HLTH holds large companies with a core-growth orientation relative to the S&P Global 1200 Healthcare Sector Index.
Chart 1: HLTH holdings based style map Chart 2: S&P Global 1200 Healthcare Sector Index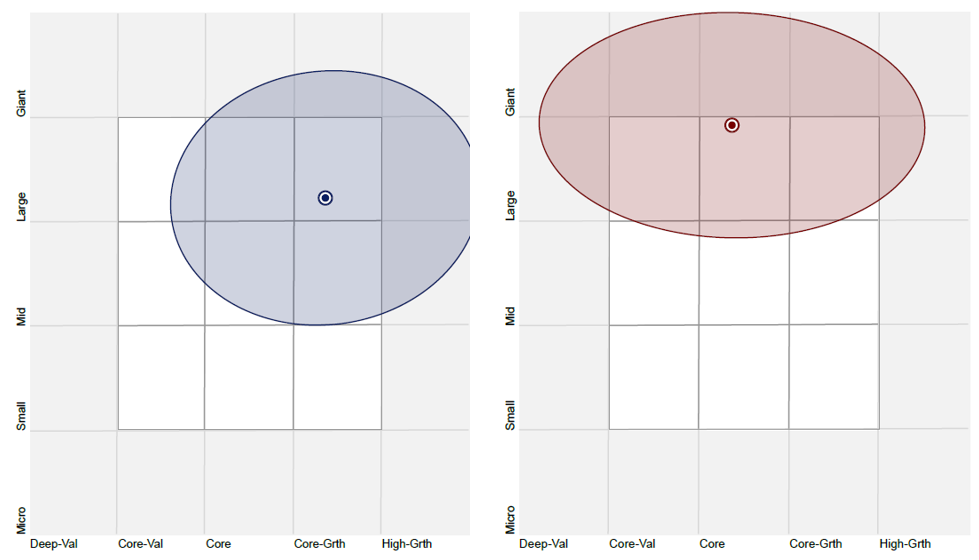
Source: Morningstar Direct, as at 30 September 2021
HLTH vs S&P Global 1200 Healthcare Sector Index - Performance
Since its launch on ASX last year HLTH has served Australian investors well.
Chart 3: Cumulative performance since HLTH ASX listing date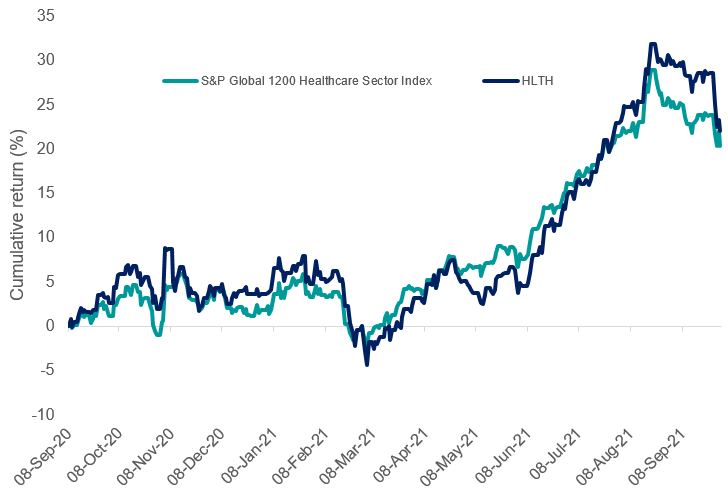
Table 4: Trailing performance
|
1 Month (%) |
3 Months (%) |
6 Months (%) |
1 Year (%) |
Since Inception (% p.a.) |
|
|
HLTH
|
-6.17 |
7.84 |
19.32 |
18.35 |
20.75 |
|
S&P Global 1200 Healthcare Sector Index |
-4.01 |
4.71 |
15.46 |
17.76 |
19.16 |
|
Outperformance |
-2.16 |
+3.13 |
+3.86 |
+0.59 |
+1.59 |
Chart 3 and Table 4 source: Morningstar Direct, MarketGrader, VanEck as at 30 September 2021. The chart and table above show past performance of HLTH and of the S&P Global 1200 Healthcare Sector Index. You cannot invest directly in an index. Results are calculated to the last business day of the month and assume immediate reinvestment of distributions. HLTH results are net of management fees and other costs incurred in the fund, but before brokerage fees and bid/ask spreads incurred when investors buy/sell on the ASX. Returns for periods longer than one year are annualised. Past performance is not a reliable indicator of future performance. The S&P Global 1200 Health Care Index (“Benchmark”) is shown for comparison purposes as it is the widely recognised benchmark used to measure the performance of the health care industry globally, weighted by market capitalisation. HLTH’s index measures the performance of 50 fundamentally sound companies with the best growth at a reasonable price (GARP) attributes in the health care industry from developed markets excluding Australia, weighted equally at rebalance. It has fewer companies and different country and industry allocations than the Benchmark. . Click here for more details.
A dedicated global healthcare strategy has its merit for portfolio inclusion and you should assess all the risks and consider your investment objectives. HLTH is an Australian first, utilising a state-of-the-art smart beta strategy.
Past performance is no guarantee of future performance. The above is not a recommendation. Please speak to your financial adviser or stock broker.
For further information, contact us via email or call us on +61 2 8038 3300.
Key risks
An investment in HLTH carries risks associated with: financial markets generally, individual company management, industry sectors, ASX trading time differences, foreign currency, country or sector concentration, political, regulatory and tax risks, fund operations and tracking an index. See the PDS for details. No member of the VanEck group of companies guarantees the repayment of capital, the payment of income, performance, or any particular rate of return from any fund.


Published: 15 October 2021