Expanding your real estate horizon
Australian investors have a love affair with property. Australian investors who want access to retail, industrial and diversified property, have used listed property trusts. Australia was one of the pioneers of listed real estate investing. General Property Trust was the first Australian Listed Property Trust (LPT) in 1971. LPT’s were subsequently renamed REITs (Real Estate Investment Trusts) in line with international practice. The S&P/ASX 200 A-REIT Index is the standard market capitalisation index for the local sector. Here we provide some insightful analysis of the index and our popular A-REIT ETF, the VanEck Australian Property ETF (MVA).
Australian investors have an affinity with property, not just residential property, but retail, office and industrial property. Australia was one of the pioneers of listed real estate investing. General Property Trust was the first Australian Listed Property Trust (LPT) in 1971. LPT’s were subsequently renamed REITs in line with international practice. Investing in A-REITs makes sense, they are an efficient way to invest in property with low entry costs compared to buying real estate directly. In addition, A-REITs generally pay more dependable and higher distributions than other Australian listed companies.
The potential for capital growth and income makes A-REITs attractive for investors. In addition, the rents charged by A-REITs to tenants is often linked to rise with CPI (Consumer Price Index). Therefore, the income that flows through to investors has an inflation protection. Historically, A-REITs have been uncorrelated to other risky asset classes such as equities, so are an important diversifier in portfolios.
To date there have been two popular approaches to investing in A-REITs:
- Via an actively managed fund; or
- Via a passive fund tracking the benchmark index. When it comes to a passive A-REITs fund, the widely used benchmark is the S&P/ASX 200 A-REIT Index.
When actively managed funds were first offered to investors, performance was uncertain and the costs were high. Sometimes the returns were good, but often they were not. In S&P’s most recent SPIVA (Standard & Poor's Index Versus Active) Australia Mid-Year 2021 report, S&P reported that 58.5% of active funds are outperformed by the index over one year and 78.8% over 10 years.
Table 1: Percentage of funds outperformed by the Index
|
Fund category |
Comparison Index |
1 year (%) |
3 year (%) |
5 year (%) |
10 year (%) |
15 year (%) |
|
Australian Equity A-REIT |
S&P/ASX 200 |
58.5 |
56.7 |
56.5 |
78.8 |
78.8 |
Innovations in index design for passive funds are delivering above market benchmark returns over the long term while retaining low costs. It is this approach that VanEck offers and it is being used by savvy investors as a way to invest in A-REITs. Source: Source: S&P Dow Jones Indices LLC, Morningstar. Data as of June 30, 2021. Past performance is no guarantee of future results.
Understandably, many people moved to lower cost passive funds that tracked traditional indices. In these new funds, returns could be thought of as average - not high, not low, just the market average. In a blog we wrote in 2017, we described the A-REIT index as an accident of history – you can read this here.
MVA’s capping methodology
The A-REIT market is dominated by a few big trusts, where the top 10 A-REITs account for over 85% of the S&P/ASX 200 A-REIT Index (as at 31 August 2021). VanEck Australian Property ETF (MVA) tracks an index that caps individual stocks at 10%. The impact is that no stock or sector dominates the portfolio. MVA’s Index (MVIS Australia A-REITs Index) is a rules-based, capped-weighted index intended to offer diversified exposure to A-REITs.
So let’s walk through the difference between MVA and the S&P/ASX 200 A-REIT Index.
MVA vs S&P A-REIT Index - Top 10 holdings
Below you can see the top 10 companies. In the S&P/ASX 200 A-REIT Index one company, Goodman Group makes up nearly a third of the index. Add Scentre Group to that and nearly 40% of the index is just two companies, not very diversified. This means that many of the smaller sized REITs do not contribute much to portfolio performance in the S&P/ASX 200 A-REIT Index compared to their impact in MVA. To see all the holdings in MVA and their weightings click here.
Table 2 Table 3
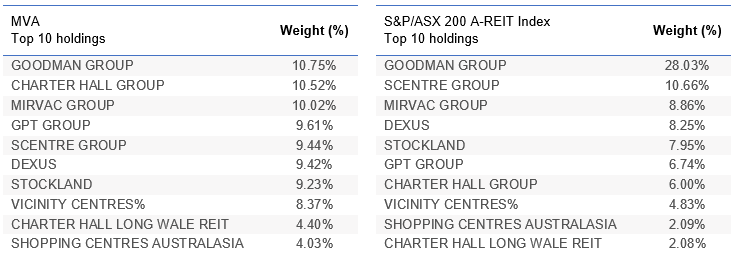
Source: VanEck, S&P, as at 31 August 2021
MVA vs S&P/ASX 200 A-REIT Index – Fundamentals
As you would expect, MVA has higher ROE and a higher EPS growth rate because of its exposure away from the two mega-REITs. MVA is also more attractive on a price to earnings, price to book and price to sales perspective.
Table 4: Statistics and fundamentals
|
|
MVA |
S&P/ASX 200 A-REIT Index |
|
Index strategy |
Smart beta |
Market capitalisation weight |
|
Number of holdings |
15 |
21 |
|
12mth trailing Dividend Yield |
1.57% |
1.20% |
|
Dividend frequency |
Semi-annually |
- |
|
Return on equity (ROE) (%) |
9.5 |
8.4 |
|
Financial leverage (debt to equity) (x) |
0.2 |
0.2 |
|
Earnings per share (EPS) growth rate (%) |
16.5 |
11.5 |
|
Price to earnings (x) |
10.8 |
12.2 |
|
Price to book (x) |
1.1 |
1.3 |
|
Price to Sales (x) |
8.7 |
9.6 |
Source: FactSet, as at 27 September 2021. Past performance is not a reliable indicator of future performance.
MVA vs S&P/ASX 200 A-REIT Index - Performance
MVA has served Australian investors well. Across the medium to long term, MVA has outperformed the S&P/ASX 200 A-REIT Index – we believe this is testament to MVA’s better diversification.
Chart 1: Cumulative performance since MVA ASX listing date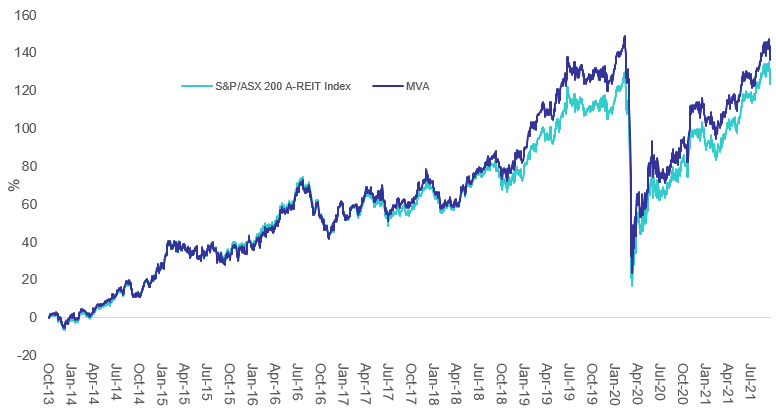
Table 2: Trailing performance
|
1 yr (%) |
3 yrs (% p.a.) |
5 yrs (% p.a.) |
7 yrs (% p.a.) |
Since Inception (% p.a.) |
|
|
MVA |
29.42 |
9.40 |
8.31 |
11.55 |
11.55 |
|
S&P/ASX 200 A-REIT Index |
29.85 |
8.57 |
7.10 |
10.78 |
10.83 |
|
Outperformance |
-0.43 |
+0.83 |
+1.21 |
+0.77 |
+0.72 |
*ASX Inception date is 14 October 2013
Chart 1 and Table 2 source: Morningstar Direct, VanEck as at 30 September 2021. The chart and table above show past performance of MVA and of the S&P/ASX 200 A-REIT Index. You cannot invest directly in an index. Results are calculated to the last business day of the month and assume immediate reinvestment of distributions. MVA results are net of management fees and other costs incurred in the fund, but before brokerage fees and bid/ask spreads incurred when investors buy/sell on the ASX. Returns for periods longer than one year are annualised. Past performance is not a reliable indicator of future performance. The S&P/ASX 200 A-REIT Index is shown for comparison purposes as it is the widely recognised benchmark used to measure the performance of the largest A-REITs in Australia, from the S&P/ASX 200, weighted by market capitalisation. MVA’s index measures the performance of the largest and most liquid ASX-listed A-REITs, with a maximum weight of 10% in each security at rebalance. MVA’s index has fewer A-REITs and different property sector allocations than the S&P/ASX 200 A-REIT Index. Click here for more details.
While each A-REIT index has its merit for portfolio inclusion, you should assess all the risks and consider your investment objectives.
Past performance is no guarantee of future performance. The above is not a recommendation. Please speak to your financial adviser or stock broker.
For further information, contact us via email or call us on +61 2 8038 3300.
Key risks
An investment in MVA carries risks associated with: financial markets generally, individual company management, industry sectors, fund operations and tracking an index. See the PDS for details.


Published: 01 October 2021
VanEck Investments Limited ACN 146 596 116 AFSL 416755 (‘VanEck’) is the responsible entity and issuer of units in the VanEck Australian Property ETF. This is general advice only, not personal financial advice. It does not take into account any person’s individual objectives, financial situation or needs. Read the PDS and speak with a financial adviser to determine if the fund is appropriate for your circumstances. The PDS is available here.
No member of the VanEck group of companies guarantees the repayment of capital, the payment of income, performance, or any particular rate of return from any fund.
MVIS Australia A-REITs Index (‘MVIS Index’) is the exclusive property of MV Index Solutions GmbH based in Frankfurt, Germany (‘MVIS’). MVIS is a related entity of VanEck. MVIS makes no representation regarding the advisability of investing in the Fund. MVIS has contracted with Solactive AG to maintain and calculate the MVIS Index. Solactive uses its best efforts to ensure that the MVIS Index is calculated correctly. Irrespective of its obligations towards MVIS, Solactive has no obligation to point out errors in the MVIS Index to third parties.