Silver’s golden outlook
Gold traded in a tight range during the first month of 2024, falling to a low of US$2,006 per ounce on January 17 as the market reassessed the odds of a US Federal Reserve (Fed) rate cut in March. The implied probability of the March rate cut dropped from 81.5% at the beginning of the year to be 35% at the end of January. Gold found support above US$2,000 per ounce despite the US dollar strengthening (DXY index was up 1.92% for the month) and yields rose. Gold finished the month at US$2,039.52 per ounce, down US$23.36 or 1.14% for the month.
Miners see further dislocation
Gold mining companies had a rough start to the year, underperforming the yellow metal. NYSE Arca Gold Miners Index was down 7.0% in January. The reason behind the amplified losses in gold stocks, relative to gold bullion, we believe, was a disappointing set of preliminary 2023 year-end operating results and the 2024 guidance for an already-unloved sector. Poor sentiment towards gold miners has translated into what we consider overselling of the companies’ shares following any announcement of weak or unexpected results.
Barrick Gold is a perfect example. The company announced 2023 fourth quarter and full-year production results that were below market consensus and company guidance. The company also noted that all-in-sustaining costs for 2023, although not reported, would also be higher than expected. The direct impact of these results on the company’s valuation is minimal, but the markets, appeared to have revised their forecasts to reflect a more negative operating outlook. We think this is reasonable, as the negative results for 2023 could indicate weakness in 2024. However, the 9% drop in Barrick’s share price looks overdone to us based on our estimates. In addition, most analysts (Barrick is well covered) kept their targets for Barrick’s shares unchanged after the announcement.
Physical demand shines bright
The World Gold Council reported total gold demand in 2023 of 4,899 tonnes, the highest on record and 3% above demand in 2022. Excluding what they refer to as OTC (over the counter) or off-exchange transactions (an estimate that captures the difference between gold supply and demand) 2023 demand was a bit (-5%) below 2022, but still strong. The changing gold demand dynamics we have been highlighting remain at play: Strong central bank buying as a dominant driver of gold prices in 2023, with demand from the official sector representing over 20% of total gold demand for the year. Net purchases of 1,037 tonnes in 2023 fell just short of the record 1,082 tonnes central banks purchased in 2022, and it is more than double the pre-2022 annual average net purchases of about 500 tonnes of gold per year. This is an impressive trend, expected to continue in the longer-term. In contrast, holdings of global gold bullion ETFs continued to see outflows in 2023, dropping by 244 tonnes, and driving total investment demand to a 10-year low, another reflection of investor’s apathy towards gold as an asset class.1
Annual gold demand by sector
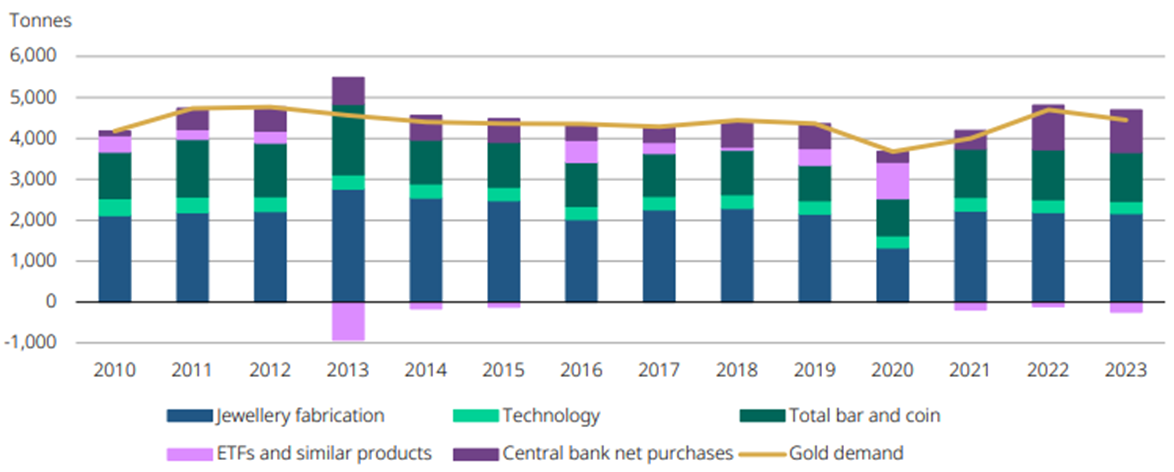
Source: World Gold Council. Data as of December 2023.
A solar silver lining
Investor apathy hasn’t been reserved only for gold. Silver, gold’s less expensive cousin, has been hit harder, underperforming gold over the last several years. The gold-to-silver ratio (the number of ounces of silver required to buy one ounce of gold) of approximately 90 at present, is well above the 20-year average of approximately 68. Silver, like gold, is a precious metal and, historically, a safe haven asset, driven by the same fundamentals that drive gold. However, silver is also an industrial metal used in a wide variety of applications including electronics, medicine, automobiles, appliances and chemical catalysts. Silver also plays a vital role in the production of solar cells.The Silver Institute estimates 2023 demand from silver used in photovoltaics (PV) at around 161 million ounces, up from 140 million ounces in 2022, and representing about 13% of total global silver demand.2 This demand is, of course, expected to continue to increase to reflect the growth of solar installations as one of the main sources of renewable energy globally. By 2028, International Energy Agency estimates that solar photovoltaics (PV) will account for about 13% of total global electricity capacity, up from approximately 5% of capacity today.3 The implications for silver is that increasing solar PV demand over the next five years and beyond is unlikely to be matched by an increase in supply.
Some rough numbers may help put this in context. A more than doubling of solar PV capacity by 2028 should translate to more than twice the PV demand for silver in 2023, or more than 300 million ounces of silver. Annual global supply of silver has been relatively unchanged over the past 10 years at approximately 1 billion ounces. Thus, this growing demand from solar applications is substantial to an industry that is inelastic when it comes to the supply side.
Not only are primary silver deposits hard to find, but very few are waiting to be developed, and even when a development decision is made the technical, economic, environmental and social studies, permitting and government regulatory requirements can take as long as a decade or more to complete. Silver, already undervalued relative to gold, could benefit not just from a bounce back to reflect multiples more in line with the historical average, but also from the additional and growing boost from solar.
2023 Performance: Gold vs Silver
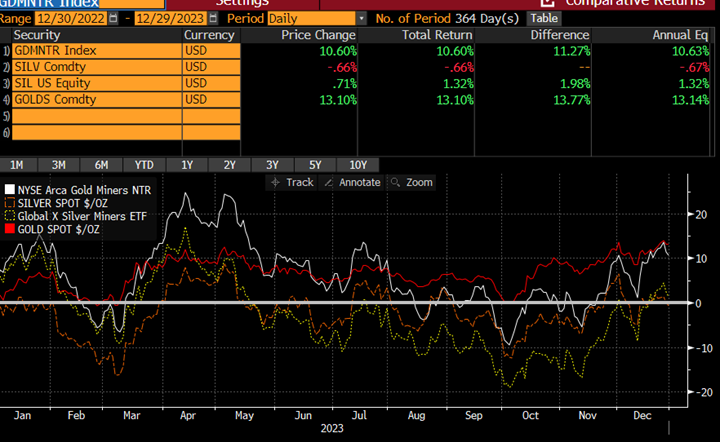
Source: Bloomberg. Data as of December 2023.
Many gold miners also source silver. Electrum is a type of rock in which the gold and silver content equal approximately 20% of the total material. Trace amounts of silver can be extracted from this gold ore product and this represents roughly a third of all silver reserves and resources.
Sources:
1https://www.gold.org/goldhub/research/gold-demand-trends/gold-demand-trends-full-year-2023
2https://www.silverinstitute.org/silver-supply-demand/
3https://www.iea.org/reports/renewables-2023/electricity


Published: 15 February 2024