Time for Australian equities investors to reassess Buffett’s advice
We revisit Buffett's advice for Australian equities investors in light of structural headwinds facing our big banks and mega miners.
In a recent Chanticleer column of the Australian Financial Review, the headline read “Time for ASX investors to rethink Buffett’s buy-and-hold advice”. The buy-and-hold advice in the headline refers to Buffett’s well-known ultra-long-term holding periods, “The money is made in investing by owning good companies for long periods of time. That’s what people should do with stocks,” Buffett said in 2016.
The article made the case that the big banks and giant iron ore miners dominate the Australian stock exchange and thus investors’ allocations but both sectors face structural headwinds. The article considers 2007’s then-large caps, now-smaller-caps AMP, QBE and LendLease and that should have shareholders thinking hard about the future.
Of course, this consideration is also in direct contradiction to another of Mr Buffett’s suggestions, that a low-cost index fund is the most sensible equity investment and many local investors invest in funds that track the S&P/ASX 200.
We think investors in those funds should think hard about the future too.
Despite rising rates, pressure remains on banks' margins and profits, and if we do head into a recession, cyclicals such as banks could face a period of underperformance.
Resources are also cyclical, and with demand from China stagnating, local miners also face headwinds. But these two sectors make up significant portions of Australian equity portfolios.
The headwinds faced by our big banks and mega miners
Assistant RBA governor, Brad Jones recently warned that our banking system was under threat in the coming decade from “new types of risks.” Some of these included artificial intelligence, cyber-attacks and a rapid run on the banks accelerated by the rapid spread of information and misinformation. He also warned of extreme weather events, a risk that can result in unexpected losses for lenders, increased claims on insurers and write-downs for investors.
But it is not only long-term structural headwinds banks are facing. Increasing competition in the mortgage market is squeezing margins. September’s APRA data revealed that CBA’s mortgage book had shrunk for the third month in a row, the first time CBA’s mortgage book had shrunk for three consecutive months since 2004 and the first quarterly fall since 2011, according to the Australian Financial Review.
This increased competition is in a period in which banks have openly stated that some of their borrowers “need ongoing support to help with practical steps to adapt to a higher rate environment.”
So, with more pressure on existing loans, and an economic outlook not conducive to growth, in addition to the long-term headwinds the RBA warned, Australia’s banks must also navigate more immediate headwinds.
Likewise, Australia’s resources sector, which benefited from the phenomenal growth of China, must navigate China’s lowering demand as its growth slows. While resource prices have remained resilient this year, increased supply from other regions such as Africa and a tepid demand in a slowdown may put pressure on prices over the short to medium term.
A different Australian equity approach
We are not saying sell or short Australian banks or mega-miners, these are some of Australia’s best run companies, we are just highlighting it may be a risk into the rest of 2024 and beyond if a sizable part of your Australian equity portfolio is overexposed to them. Most Australian equity portfolios benchmarked to the S&P/ASX 200 are likely to have an exposure to the big 4 banks around the 25% range because that is their representation of the benchmark index. 10% is BHP.
VanEck Australian Equal Weight ETF (MVW) is the only equal weight Australian equity portfolio on ASX and it currently has less than 7% exposure to the big four banks and BHP. We think MVW is an ideal low-cost core allocation around which ideas can be added.
If you have MVW as a core Australian equity portfolio and you believe the economic environment will become favourable for banks, you can add to your MVW portfolio by buying your preferred bank directly as a satellite position. Alternatively, you could consider the VanEck Australian Banks ETF. In this way, ETFs are efficient tools to express portfolio ideas for the prevailing economic environment.
MVW vs S&P/ASX 200 Index – A more balanced approach
The index MVW tracks equally weights the largest and most liquid stocks on the ASX at each rebalance. Because of this, at the last rebalance, no company was more than 1.27%. What this means is that if ANZ or CBA goes up or down 5%, its impact on the S&P/ASX 200 is greater than it is on MVW.
A consequence of the equal weight methodology is that MVW, relative to the S&P/ASX 200, is underweight those sectors that contain larger than average companies. For example, MVW is currently underweight the financials sector by over 8% and materials by 5.8%. Conversely, it will be overweight sectors that contain smaller than average companies. MVW is currently overweight industrials by 8.1%, REITs by 4.9% and consumer staples by 2.2%. Therefore, MVW has less sector concentration risk than the S&P/ASX 200.
Chart 1: S&P/ASX 200 and MVW Index sector weightings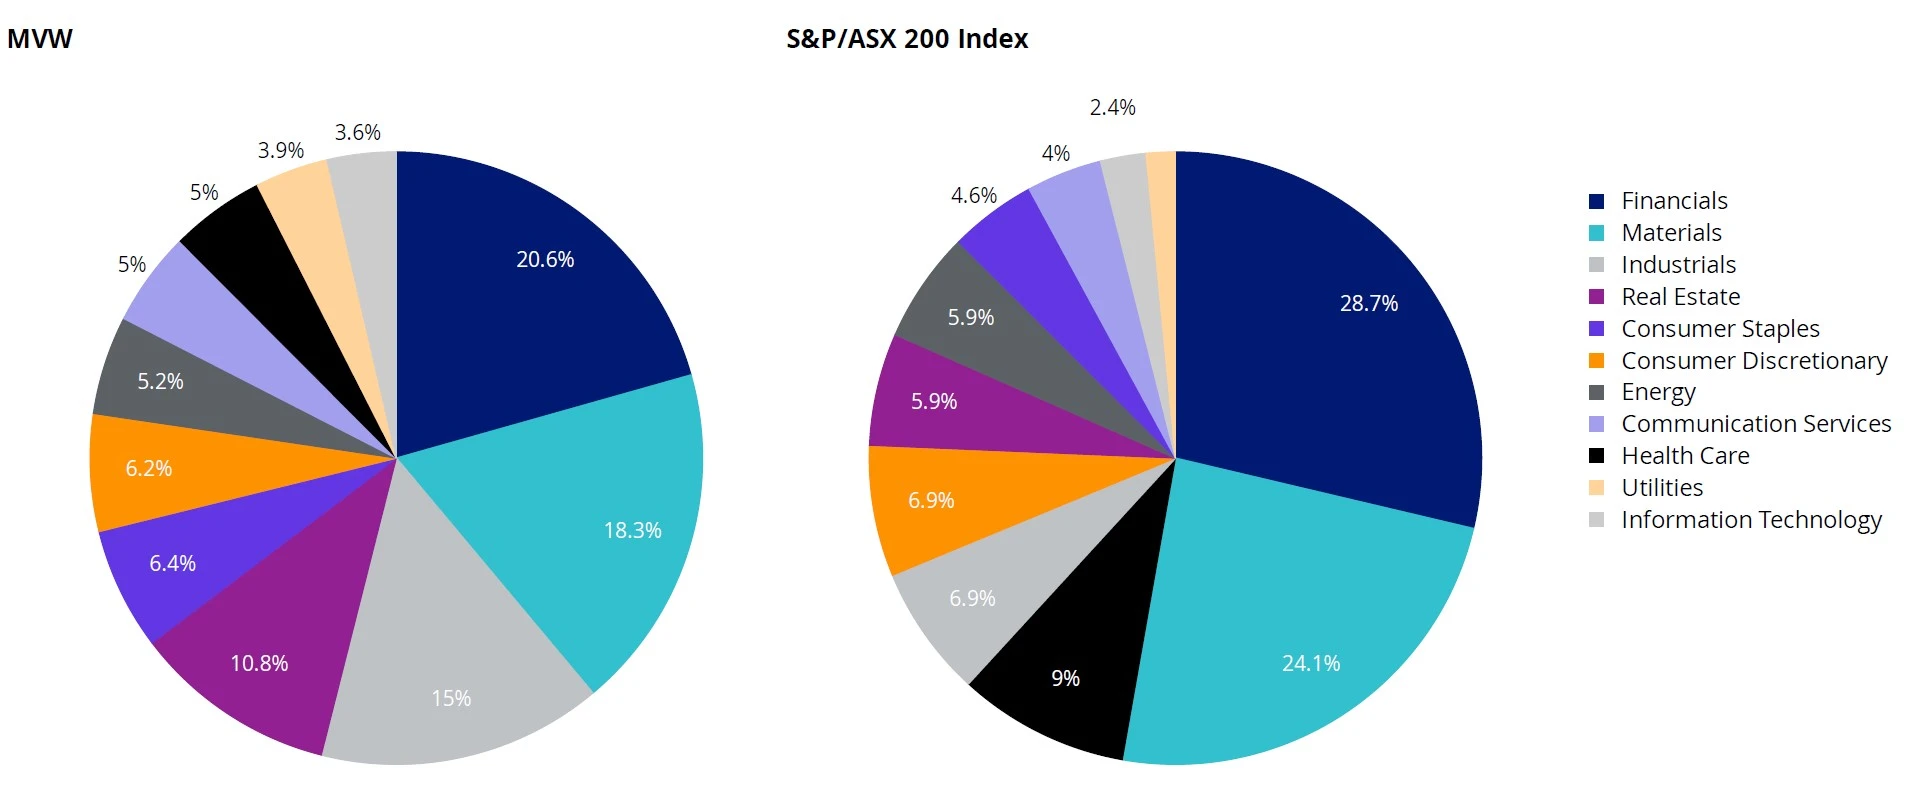
Source: FactSet, 30 September 2023
Long-term outperformance
Because of its larger allocation to companies outside the largest 15 companies on ASX, over the long term, MVW has outperformed. Since its inception in 2014, to 8 May 2023, MVW has outperformed the S&P/ASX 200 Index by 174 basis points per annum. As always, past performance is by no means a reliable indicator of future performance.
Chart 2: Cumulative performance: MVW versus S&P/ASX 200 Index since inception to 31 October 2023
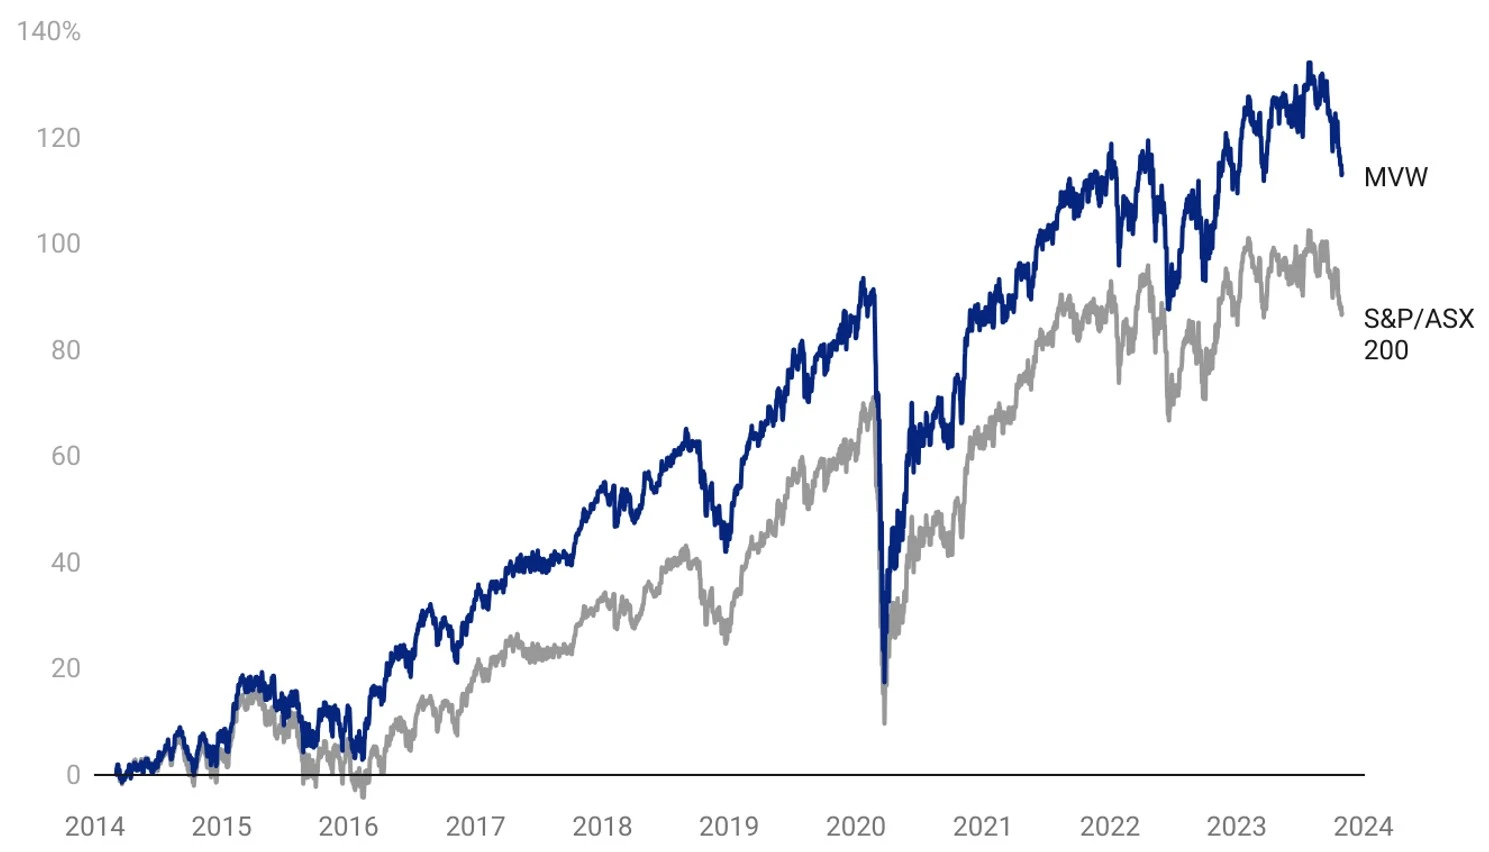
Table 1: MVW Performance to 31 October 2023
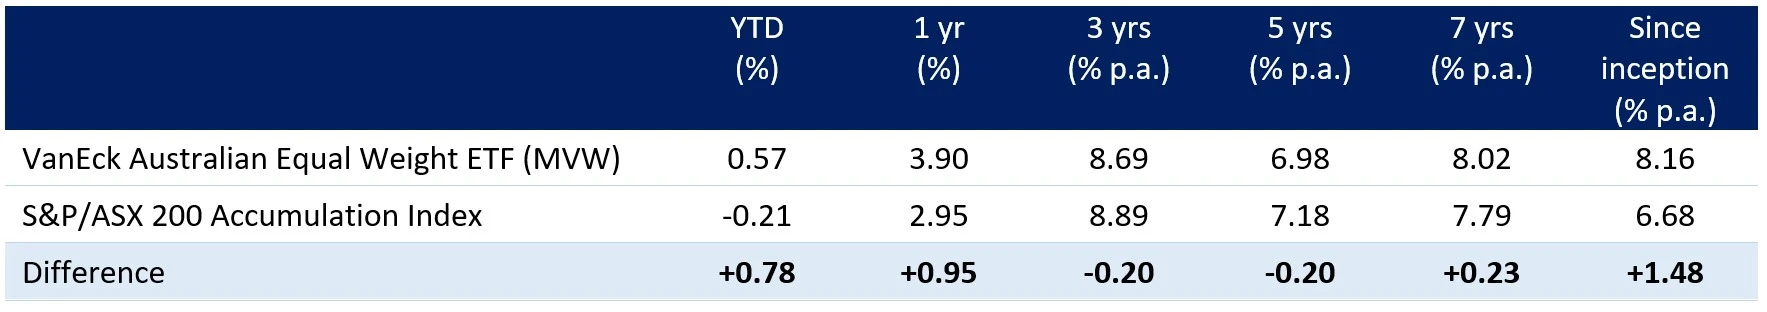
Inception date is 4 March, 2014.
Chart 2 and Table 1: Source: Morningstar Direct, VanEck. Results are calculated daily and assume immediate reinvestment of all dividends. MVW results are net of management fees and other costs incurred in the fund but do not include brokerage costs and buy/sell spreads incurred when investing in MVW. Past performance is not a reliable indicator of future performance. You cannot invest directly in an index. The S&P/ASX 200 Index is shown for comparison purposes as it is the widely recognised benchmark used to measure the performance of the broad Australian equities market. It includes the 200 largest ASX-listed companies, weighted by market capitalisation. MVW’s index measures the performance of the largest and most liquid ASX-listed companies, weighted equally at rebalance. MVW’s index has fewer companies and different industry allocations than the S&P/ASX 200.
Past performance is no guarantee of future performance. The above is not a recommendation. Please speak to your financial adviser or stock broker.
For further information you can email us or call on us on +61 2 8038 3300.
Key risks
An investment MVW carries risks associated with: ASX trading time differences, financial markets generally, individual company management, industry sectors, country or sector concentration, political, regulatory and tax risks, fund operations and tracking an index. See the PDS for details.


Published: 11 November 2023
Any views expressed are opinions of the author at the time of writing and is not a recommendation to act.
VanEck Investments Limited (ACN 146 596 116 AFSL 416755) (‘VanEck’) is the issuer and responsible entity of all VanEck exchange traded funds (Funds) listed on the ASX. This is general advice only and does not take into account any person’s financial objectives, situation or needs. The product disclosure statement (PDS) and the target market determination (TMD) for all Funds are available at vaneck.com.au. You should consider whether or not an investment in any Fund is appropriate for you. Investments in a Fund involve risks associated with financial markets. These risks vary depending on a Fund’s investment objective. Refer to the applicable PDS and TMD for more details on risks. Investment returns and capital are not guaranteed.
MVIS Australia Equal Weight Index (‘MVIS Index’) is the exclusive property of MV Index Solutions GmbH based in Frankfurt, Germany (‘MVIS’). MVIS is a related entity of VanEck. MVIS makes no representation regarding the advisability of investing in the Fund. MVIS has contracted with Solactive AG to maintain and calculate the MVIS Index. Solactive uses its best efforts to ensure that the MVIS Index is calculated correctly. Irrespective of its obligations towards MVIS, Solactive has no obligation to point out errors in the MVIS Index to third parties.