VanEck’s Australian equities outlook recap: Mid-caps to shine
VanEck's Australian equities outlook published this week dissects our views on inflation, policy rates, economic growth, external risks and market implications as the lagged effect of one of the sharpest RBA rate hike cycles hits hardest this year.
Macroeconomic views
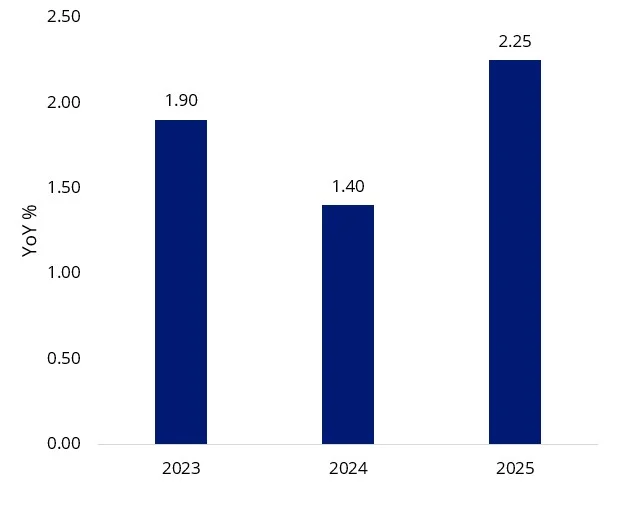
On balance, we think Australia could avoid a recession with the RBA holding the cash rate at 4.35% until at least 2025. Inflation may prove to be stickier than the market anticipates, which reaffirms our higher-for-longer bias. We urge investors to watch out for potential external risks relating to heightened geopolitical tensions and economic breaks following the sharp rate hike cycle.
The Reserve Bank of Australia is contending with inflationary supply-side constraints, limiting monetary policy effectiveness and this will likely result in the cash rate remaining on hold until at least 2025.
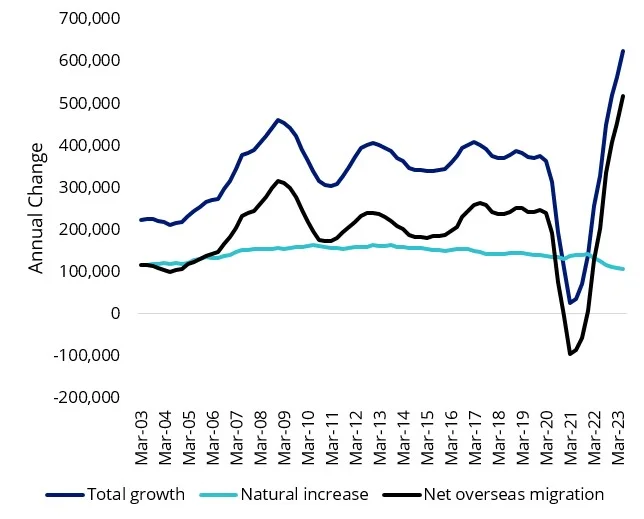
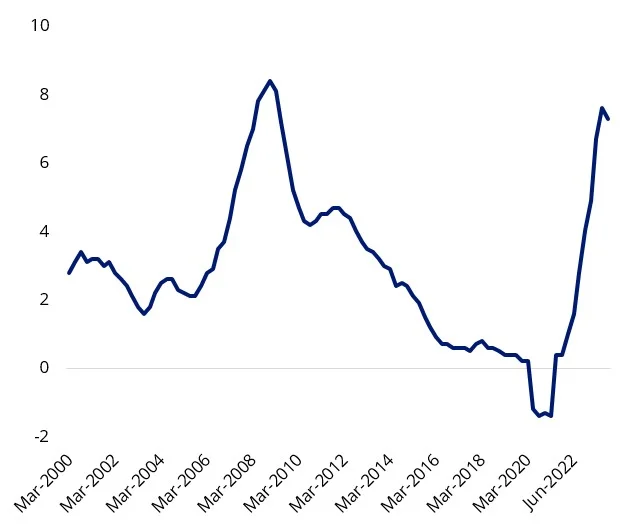
Rental inflation, which is the largest contributor to services inflation, is the highest it’s been since 2009 and it shows little sign of easing. A migration surge and limited new housing supply have created a significant demand-supply imbalance. Rental vacancy rate is at an all-time low. It took four years for rental inflation following the Global Financial Crisis (GFC) to return to a 2-3% range.
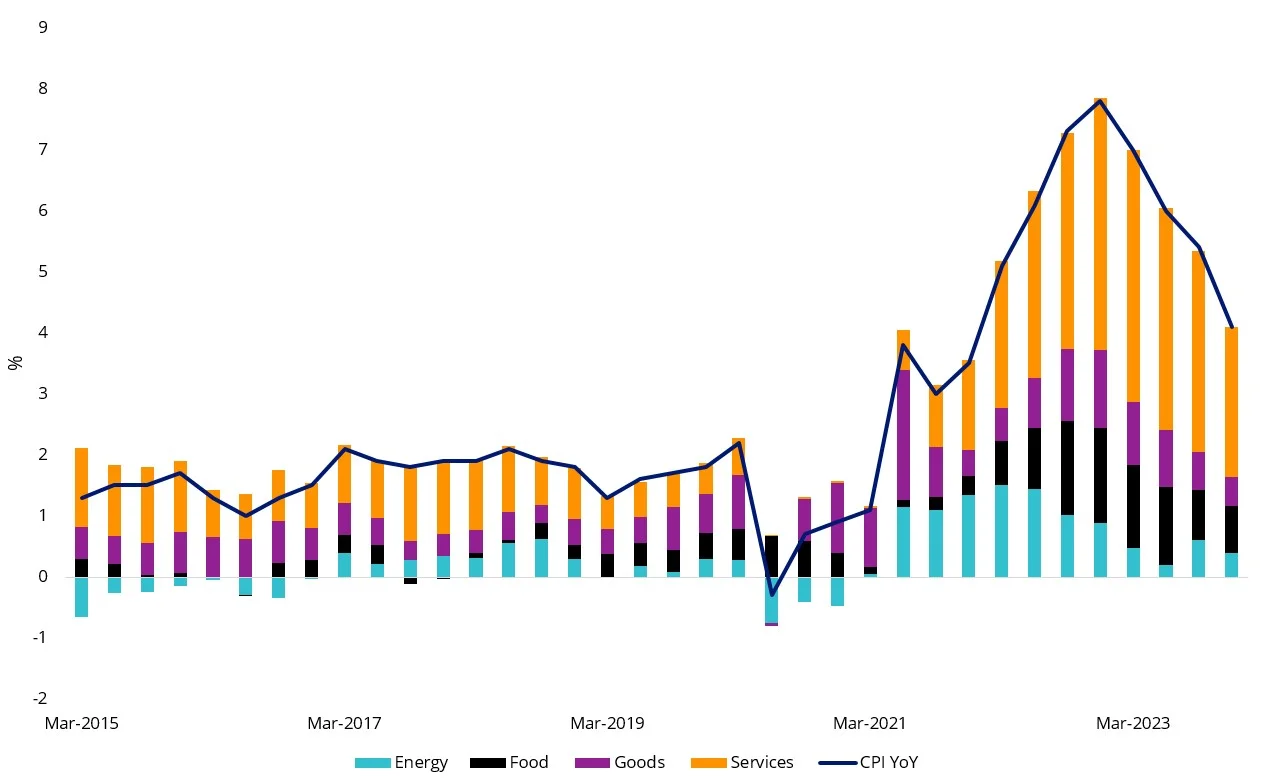
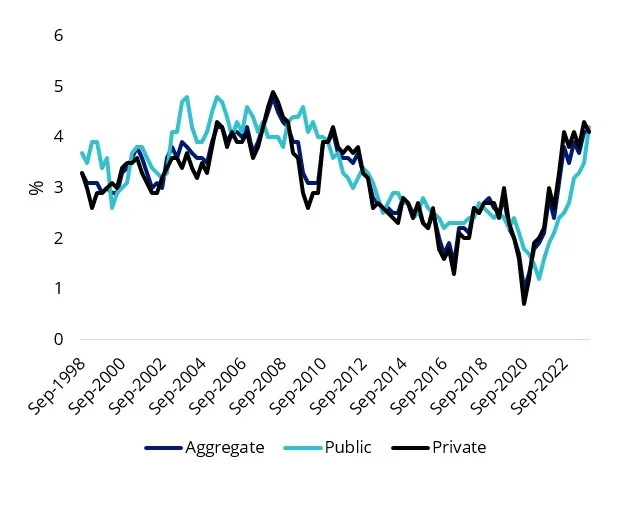
Wage push inflation is also an inflation threat. Aggregate wage growth is above the RBA’s published target rate of 3.5% and has not been supported by productivity gains. Public sector wage growth cap removals and minimum wage and award increases close to 6% last year have contributed to strong services and food inflation, which are above pre-covid levels.
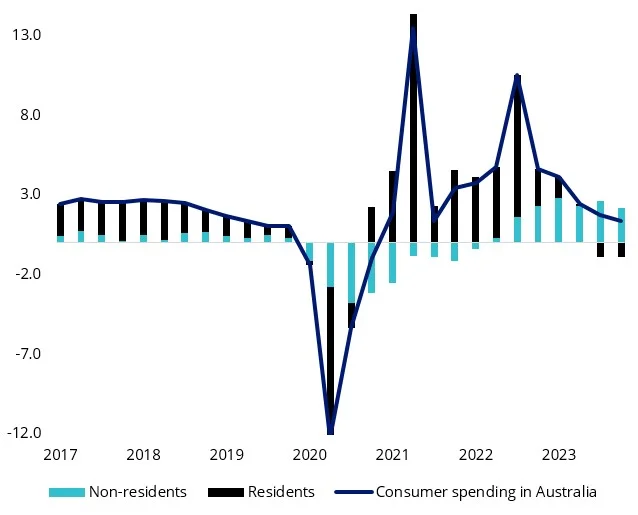
While high migration is adding inflationary pressures, it is beneficial for growth over the medium term. Non-residents have been recent drivers of aggregate consumer spending growth, while Australian residents have curbed spending to tackle higher mortgage repayments. The RBA’s mandate of achieving “price stability and full employment” increases the chance of a soft landing. The bank has noted that its primary objective is to avoid a recession at the expense of a longer period of elevated inflation. RBA’s latest forecast has inflation returning to the 2-3% target range in late 2025.
Chart 1: Australian CPI year on year: Food and services inflation above pre-COVID trend
|
Chart 2: Australian wages growth year on year |
Chart 3: Australian real GDP growth consensus forecast |
 |
 |
|
Source: Australian Bureau of Statistics, as at 31 March 2024. |
Source: Bloomberg consensus forecast, Bloomberg, as at 31 March 2024. |
|
Chart 4: Australian population annual change - Migration surge fuelling inflation |
Chart 5: Australia rent inflation year on year - Highest since the Global Financial Crisis |
 |
 |
|
Source: Australian Bureau of Statistics, as at 31 March 2024. |
Source: Australian Bureau of Statistics, as at 31 March 2024. |
Market views
Australian mid-caps could be set to shine during the next stage of the market recovery. Valuations are attractive and smaller companies typically outperform in prolonged market recoveries. Sector-wise, A-REITs, industrials and consumer discretionary are our best picks.
Australia’s equity benchmark, the S&P/ASX 200 has finally surged above the previous three-year resistance level of 7,500. We believe the upward price movement is sustainable given valuations are attractive and the increasing likelihood of a soft landing is supporting market confidence. Australian equity price to 12 months forward earnings is trading near its historical average. We forecast the S&P/ASX 200 to reach 8,300 by year-end (+6.4%).
The next stage of the market recovery could see mid-caps and equal weight outperform for several reasons. Firstly, smaller-sized companies offer more upside potential through market share expansion and have historically outperformed in prolonged market recoveries. Valuations are attractive. 12-month forward PE is trading below its historical average. Mid-caps also reported the highest upside price target revisions during the February earnings season.
We could see a paradoxical dynamic play out in which economic growth is resilient but mortgage stress increases as rates stay higher for longer. Australia’s migration surge will continue to support aggregate retail spending and therefore consumer discretionary performance. The sector reported strong net beats during the February earnings season. Near-record low unemployment and improvement in Australia’s economic outlook will likely improve consumer confidence and support spending.
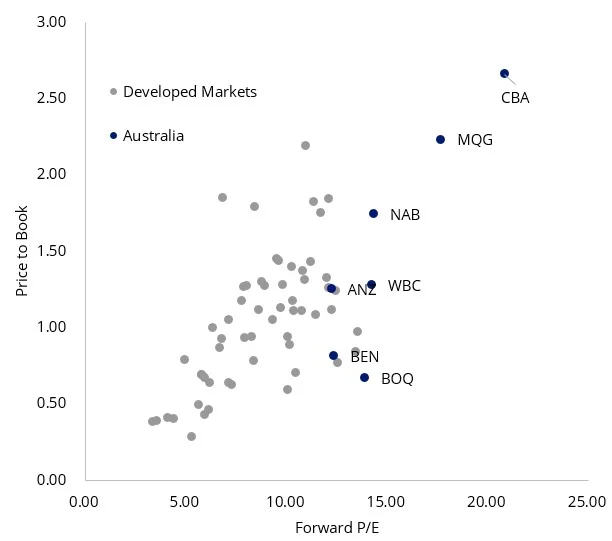
However, Australia’s banks are overvalued. They are the most expensive globally and 12-month forward PE at the upper bound of historical averages. The market is underestimating the likelihood of a flare-up in mortgage stress in a prolonged higher interest rate environment.
We think A-REITs are well-positioned to outperform for several reasons. Interest rate stabilisation and a positive economic outlook improves confidence in the assessment of valuations, encouraging capital recycling. REIT leverage levels have decreased, and interest coverage levels have increased steadily since the global financial crisis. Office REITs offer attractive discounts to NTA. The fall in occupancy rates has stabilised and net operating income has picked up. Retail REITs are fairly priced. Occupancy rates are strong and net operating income has accelerated. Industrial REIT Goodman Group's 12-month forward PE is trading at the upper bound of its historical average. It could be vulnerable to a correction if double-digit earnings growth is not maintained.
Chart 6: S&P/ASX 200 versus Equal Weight cumulative performance - Equal Weighting historically outperformed in bull markets
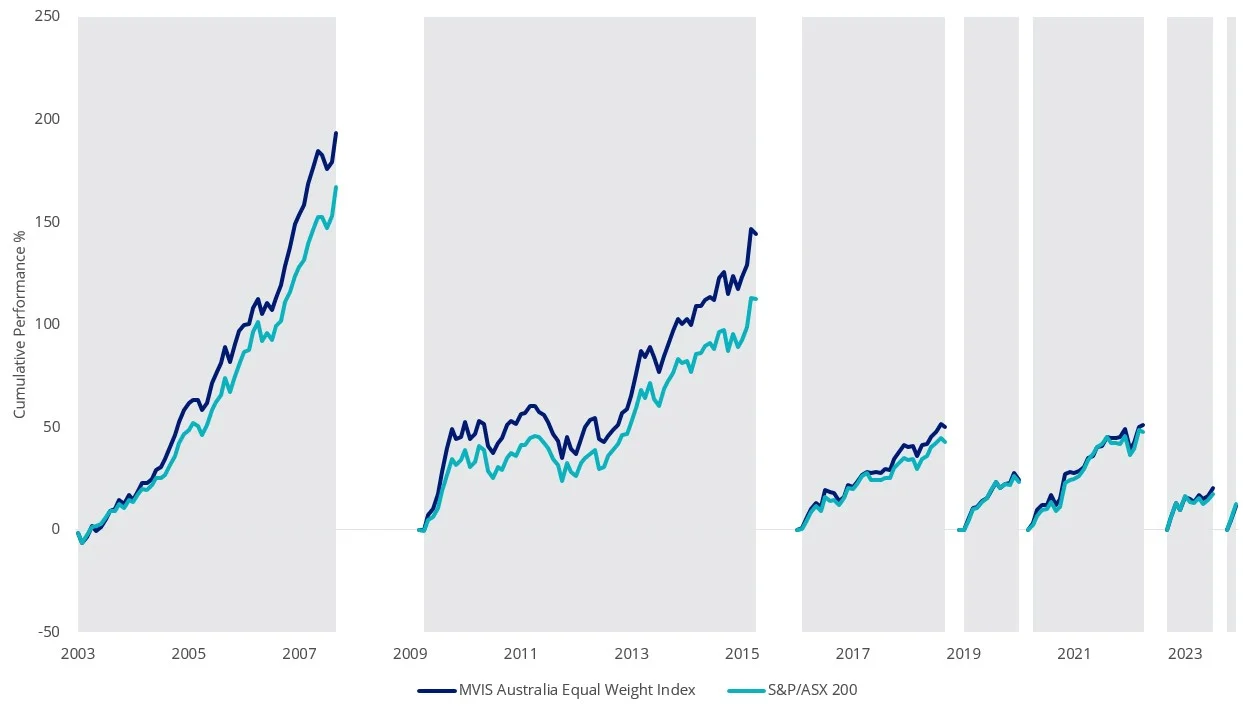
Source: Bloomberg. Past performance is not indicative of future performance. You cannot invest in an index.
|
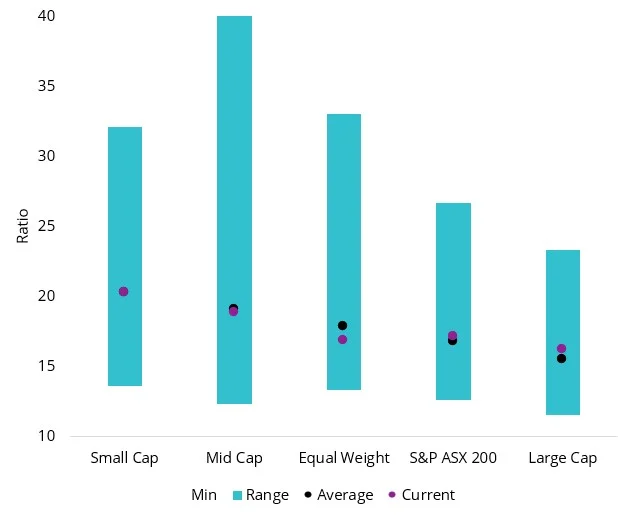
Chart 7: Price to 12m forward earnings - Equal weight below historical average |
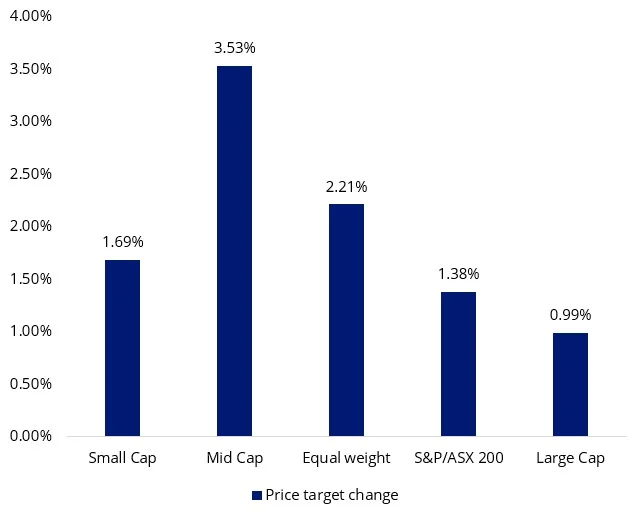
Chart 8: 12m consensus price target revisions during February earnings season |
 |
 |
|
Source: Bloomberg, 1 April 2014 to 31 March 2024 (PE ratio), Large Cap as S&P/ASX 20, Mid Cap as S&P/ASX Mid Cap 50, Small Cap as S&P/ASX Small Ordinaries, Equal Weight as MVIS Australia Equal Weight. The ASX index series is shown for comparison purposes as it is the widely recognised benchmark series used to measure the performance of the Australian equities market. It weights companies by market capitalisation. MVW’s index (MVIS Australia Equal Weight) measures the performance of the largest and most liquid ASX-listed companies, weighted equally at rebalance. MVW’s index has a different amount of companies and different industry allocations than the S&P/ASX indices. |
Source: Bloomberg, 31 January to 29 February 2024 (price change), Large Cap as S&P/ASX 20, Mid Cap as S&P/ASX Mid Cap 50, Small Cap as S&P/ASX Small Ordinaries, Equal Weight as MVIS Australia Equal Weight. The ASX index series is shown for comparison purposes as it is the widely recognised benchmark series used to measure the performance of the Australian equities market. It weights companies by market capitalisation. MVW’s index (MVIS Australia Equal Weight) measures the performance of the largest and most liquid ASX-listed companies, weighted equally at rebalance. MVW’s index has a different amount of companies and different industry allocations than the S&P/ASX indices. |
|
Chart 9: Global bank valuations |
Chart 10: Australian consumer spending YoY - Migrants offsetting resident spending slowdown |
 |
 |
|
Source: Bloomberg, 31 March 2024. |
Source: ABS, Morgan Stanley. |


Published: 16 April 2024
Any views expressed are opinions of the author at the time of writing and is not a recommendation to act.
VanEck Investments Limited (ACN 146 596 116 AFSL 416755) (VanEck) is the issuer and responsible entity of all VanEck exchange traded funds (Funds) trading on the ASX. This is general advice only and does not take into account any person’s financial objectives, situation or needs. The product disclosure statement (PDS) and the target market determination (TMD) for all Funds are available at vaneck.com.au. You should consider whether or not an investment in any Fund is appropriate for you. Investments in a Fund involve risks associated with financial markets. These risks vary depending on a Fund’s investment objective. Refer to the applicable PDS and TMD for more details on risks. Investment returns and capital are not guaranteed.