RBA vs CPI: It’s a battle royale
CPI remains as stubborn as ever despite high rates. Not just here. The US Fed has a fight on its hands too.
Interest rate expectations have changed. The chances of cuts in 2024 are fading.
The changes in rate expectations have been changing the prices of bonds. Bonds that do not mature until well into the future (beyond five years) have been falling in value because these are more sensitive to changes in interest rate expectations.
Meanwhile, shorter-dated bonds, those that mature sooner, have been outperforming. This is because these bonds are less sensitive to changes in interest rate expectations.
Interest rates and duration
As interest rates rise, the values of existing bonds go down because demand for those bonds falls in favour of newer bonds paying a higher coupon. This is a concept called duration. Duration measures the sensitivity of a bond to changes in interest rate movements. For example, if the duration of a bond is 4.00, it means that with a 1% interest rate rise, the value of the bond would fall 4.00%.
It’s important to note that as interest rates rise and the value of the bond falls, the bond’s yield rises. A bond’s yield always moves in the opposite direction of its price.
On the other side of the equation, when interest rates fall, existing bonds become more valuable because their coupons are relatively high compared to new bonds. However, the yield of these bonds would fall, moving in the opposite direction of the bond’s price.
The yields on bonds are often expressed by ‘yield to maturity’ (YTM). YTM is the annual rate of return expected on a bond if you purchase it at the current market price and then hold it until its maturity date. The YTM of the bond will change as price changes. If the bond price falls, its YTM goes up and vice versa.
As the bond nears its maturity date its price becomes closer to, then equal to, its face value and this is one of the reasons shorter-duration bonds tend to be less sensitive to interest rate movements.
The inflation fight
Inflation is a key driver of interest rates. Central banks, such as the RBA, adjust the cash rate (interest rates) to manage inflation. Generally, if inflation is increasing, the RBA will respond and increase cash rates, and vice versa. According to the RBA’s own website, “A powerful lesson from history is that low and stable inflation is a prerequisite for a strong economy and sustained full employment and growth in real wages.” It therefore has a “flexible inflation target, which aims to keep consumer price inflation between 2 and 3 per cent.”
In anticipation of RBA rate decisions, bond prices will change in response to inflation. And the changes will not be uniform. Longer-dated bonds will not experience the same price, and thus yield changes, as shorter-dated bonds.
Bond markets plot the yields of Australian Government Bonds (AGBs) with differing maturity dates. This is called the yield curve. Investors use AGBs to plot the yield curve because AGBs have equal (high) credit quality.
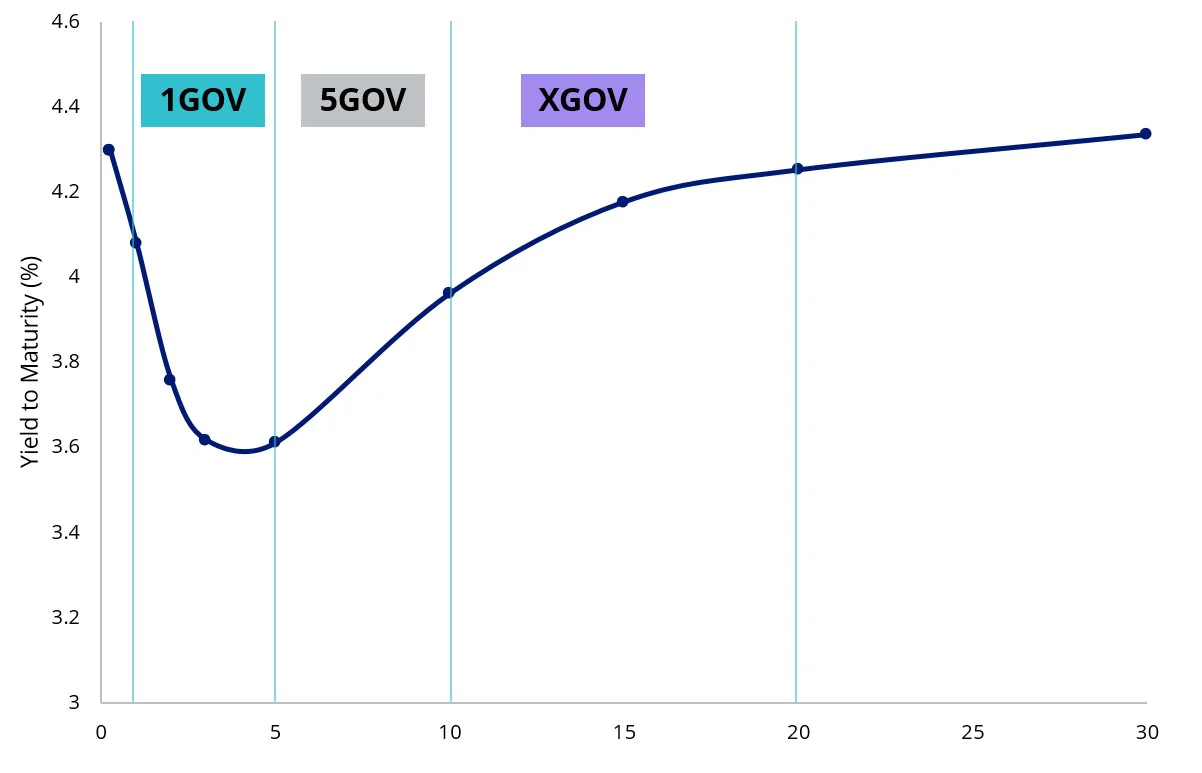
Chart 1: The Australian Government Bond yield curve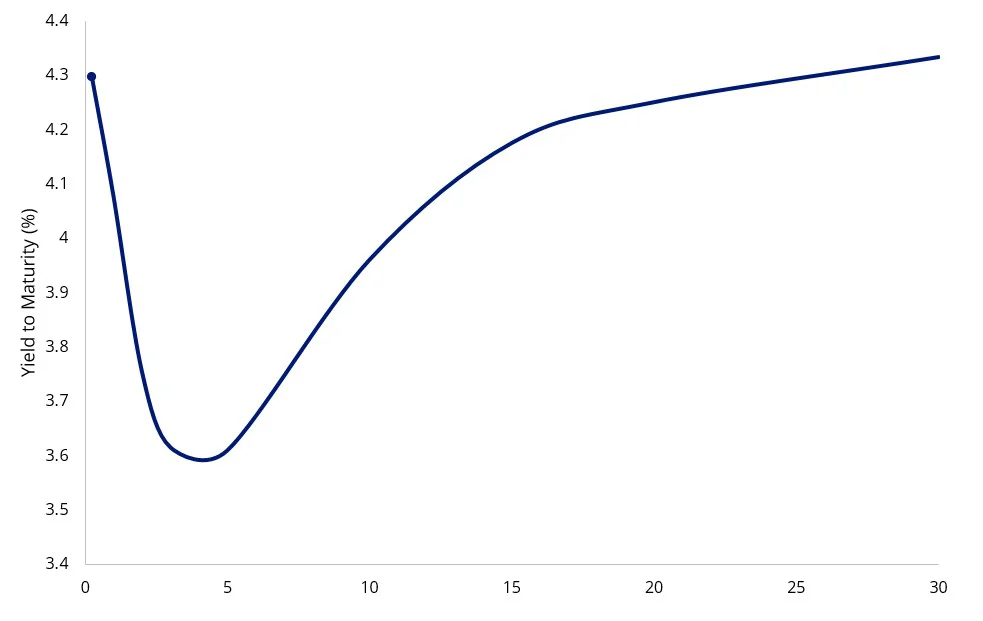
Source: Bloomberg, April 2024.
By valuing AGBs with different maturities, the yield curve is, in effect, forecasting where it thinks the economy is headed, and thus the RBA’s policy moves. This creates an opportunity for investors because as we have seen the market can be wrong. At the start of the year, for example, the market predicted three rate cuts by the end of 2024. Now, after the most recent CPI print, there is a 50 per cent chance of another rate hike.
Therefore, if investors were positioned properly, in this instance, in shorter-dated bonds, they would have outperformed as the market’s expectations of rate cuts dimmed.
Bond investors that add relative value to their bond portfolio by targeting different durations, based on where they think rates will go, are said to be ‘playing the yield curve’.
ETFs make this possible for every type of investor.
Playing the yield curve
The yield curve's slope reflects the difference between yields on short-term and long-term bonds. The yields on short and long-term bonds can be different because investors forecast that the cash rate in the future might differ from the cash rate today.
For example, the yield on a ten-year bond reflects investors' expectations for the cash rate over the next ten years and the uncertainty associated with longer term forecasting. Because longer-term yields are more difficult to predict, their yields tend to move more than shorter-term bonds.
A bond portfolio exposure can therefore be constructed to be either overweight or underweight the short, the medium or the long end of the yield curve depending on how the investor feels about the economy and rates. Here are some examples.
First, it’s important to understand the shape of the curve. A ‘normal’ yield curve is upward sloping where short-term yields are lower than long-term yields. Typically, this yield curve is seen during periods of economic expansion. In this environment, investors demand higher yields on longer-term bonds as compensation for inflation and future rate rises.
Chart 2: Normal Yield Curve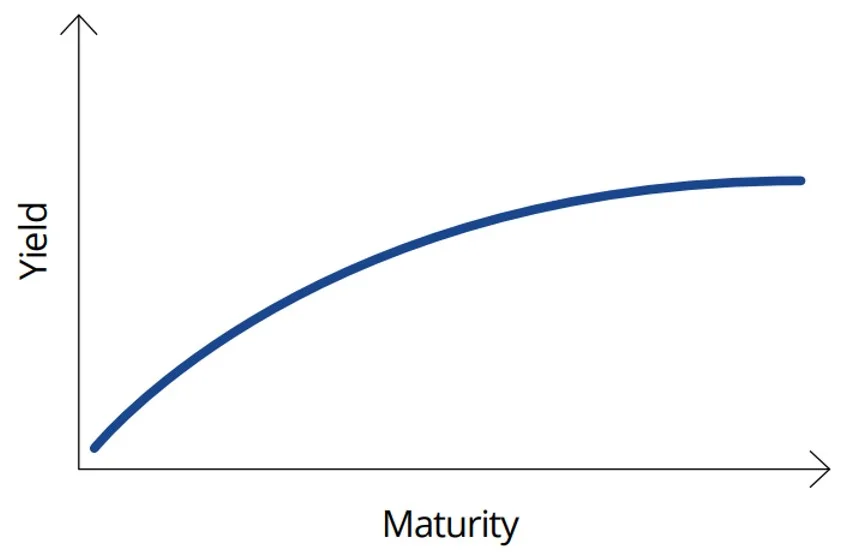
Source: VanEck. For illustrative purposes.
So, when bond markets predict economic conditions to deteriorate and rate expectations to fall, the long end of the curve typically decreases, resulting in a ‘flattening’ of the curve.
Chart 3: Normal to flat yield curve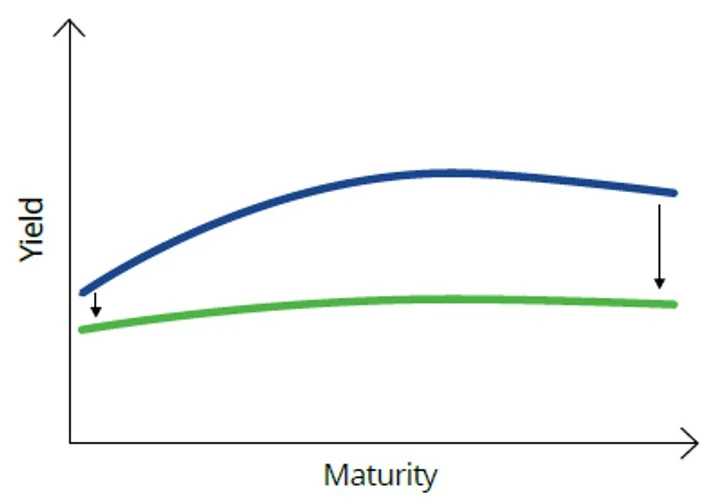
Source: VanEck. For illustrative purposes.
A more extreme scenario is when bond markets forecast the economy to enter a recession or slowdown. This is when the yield curve inverts, that is short-dated yields are higher than long-dated. In the US, when this happens it is often a leading indicator of an impending recession. At the very least, an inverted curve may indicate that economic growth will slow and that central banks will need to cut rates, in the near term, to stimulate economic growth.
Chart 4: Inverted yield curve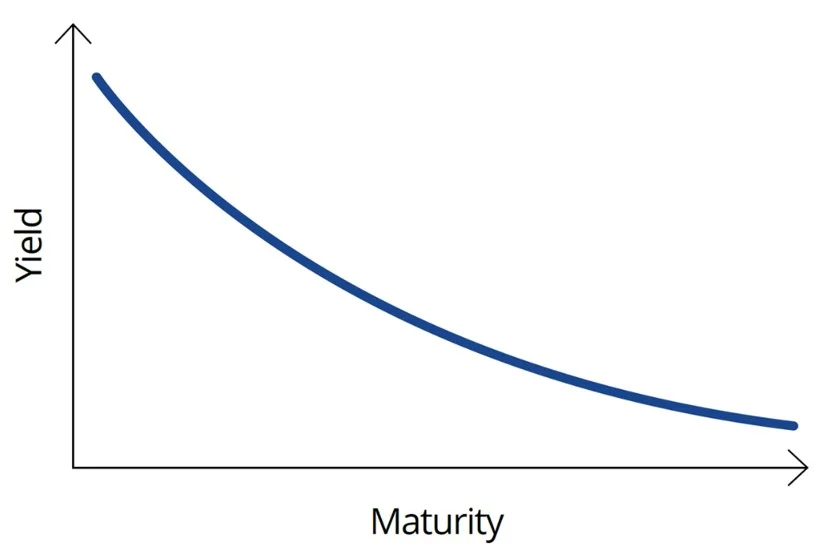
In both scenarios, investors with long-dated yield exposure benefit from bond price increases as yields fall. Investing in long-dated bonds is considered a defensive strategy as prices typically increase when forecast economic conditions deteriorate.
In another scenario, the yield curve can steepen at the long end, higher than at the short end. In bond markets, this is known as a 'bear steepen'. Bear, because rises in yields are bad, or ‘bearish’, for bonds. Typically, this yield curve movement is associated with an environment in which investors think interest rates and economic activity will rise. Shortest duration exposure is preferred here, to minimise the negative impact of rising yields on bond prices.
Chart 5: Normal to bear steepen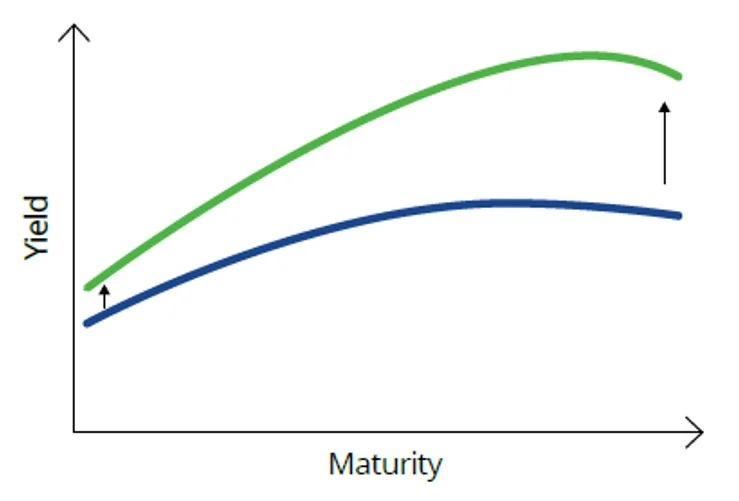
Source: VanEck. For illustrative purposes.
Sometimes yields fall, but short-term yields fall by more than long-term yields. This may occur in a falling-rate environment when the market thinks there will be near-term rate cuts and there will only be a few or they will be temporary. The jargon for this is a ‘bull steepen’ (bull – because falls in yields are good, or bullish, for bonds). Exposure to the short and middle parts of the curves is preferred to benefit more from the impact of falling yields on bond prices.
Chart 6: Normal curve to bull steepens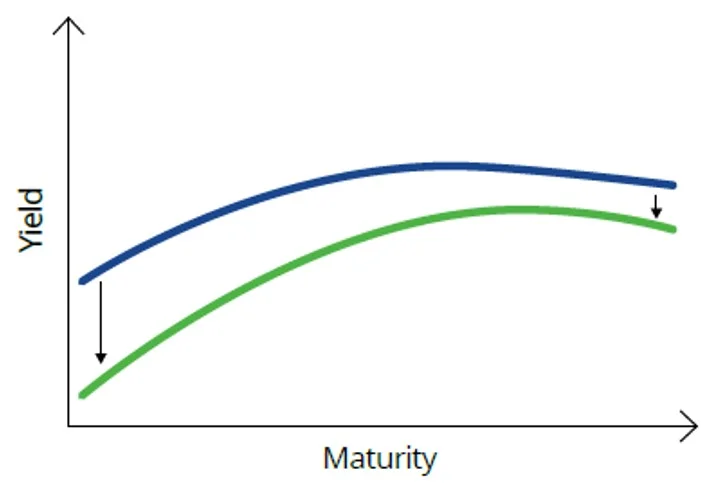
Source: VanEck. For illustrative purposes
Accessing different parts of the Australian yield curveThree AGB ETFs allow investors a way to ‘play the yield curve’:
- VanEck 1-5 Year Australian Government Bond ETF (ASX code: 1GOV)
- VanEck 5-10 Year Australian Government Bond ETF (ASX code: 5GOV)
- VanEck 10+ Year Australian Government Bond ETF (ASX code: XGOV)
Not a recommendation to act. For illustrative purposes only. Source: VanEck, April 2024. Yield measures are not a guarantee of future dividend income from the funds.
In our last Vector Insights, Good Yield Hunting, we described those investors who would play the yield curve as active yield hunters. It is not risk-free, but it can be rewarding.
Hopefully, you’re ready to enter the ring with the RBA and CPI.
As always, we would recommend you speak to your financial adviser to determine which fixed-income investment is right for you.
Key risks
An investment in the ETFs carry risks associated with: interest rate movements, bond markets generally, issuer default, credit ratings, country and issuer concentration, liquidity, tracking an index and fund operations. See the PDS for more details.


Last Updated On: 05 May 2024
Any views expressed are opinions of the author at the time of writing and is not a recommendation to act.
VanEck Investments Limited (ACN 146 596 116 AFSL 416755) (VanEck) is the issuer and responsible entity of all VanEck exchange traded funds (Funds) listed on the ASX. This is general advice only and does not take into account any person’s financial objectives, situation or needs. The product disclosure statement (PDS) and the target market determination (TMD) for all Funds are available at vaneck.com.au. You should consider whether or not an investment in any Fund is appropriate for you. Investments in a Fund involve risks associated with financial markets. These risks vary depending on a Fund’s investment objective. Refer to the applicable PDS and TMD for more details on risks. Investment returns and capital are not guaranteed.