Quality investing to keep Calm(ar)
Quality investing is known for its relative resilience to market drawdowns and economic headwinds. Employing the Calmar ratio, we examine this approach in global equities.
Fears around any sort of landing into 2024 have come to the fore, and given recent market gyrations it is during these times that quality has historically been the ‘go-to’ factor. In past slowdowns and subsequent corresponding recoveries, quality's defensive characteristics have been reinforced. Savvy investors are considering, or already making, those incremental changes that reinforce a portfolio to navigate the global macroeconomic environment.
Measuring risk-adjusted returns
Since the advent of modern portfolio theory, volatility of returns has been used by investment professionals as a measure of risk. But the reality is, no investor wants to lose money, so for many investors, the risk of negative outcomes or the risk of potential losses is how they consider ‘risk’.
Drawdown is a useful measure of this risk. It measures the depth of a fall of an investment from a previous peak. When comparing similar investments, the lower the maximum drawdown, generally the more desirable the investment.
Combining the maximum drawdown, with the return measure gives us the Calmar ratio. It is different from Sharpe, Sortino or Sterling ratios as measures for risk-adjusted returns in that it uses maximum drawdown as a measure of risk, not volatility, semi-deviation or average drawdown. It is commonly used for hedge funds, and it is commonly calculated using the previous three, five or ten year drawdown and return measures.
The VanEck MSCI International Quality ETF (QUAL) which tracks the MSCI World ex Australia Quality Index is being used by savvy ASX investors to access the quality factor. Below we present QUAL’s Calmar ratio, calculated monthly using the previous 60 months (5 years) drawdown and return measure. The five-year measure is used because according to QUAL’s TMD a consumer’s intended investment time frame would extend beyond medium (> 2 years) and long (>8 years).
You can see that since its inception, QUAL’s Calmar ratio is consistently higher than the MSCI World ex Australia Index, indicating better long-term risk-adjusted returns.
Chart 1: Five-year rolling Calmar ratio: QUAL versus MSCI World ex Australia Index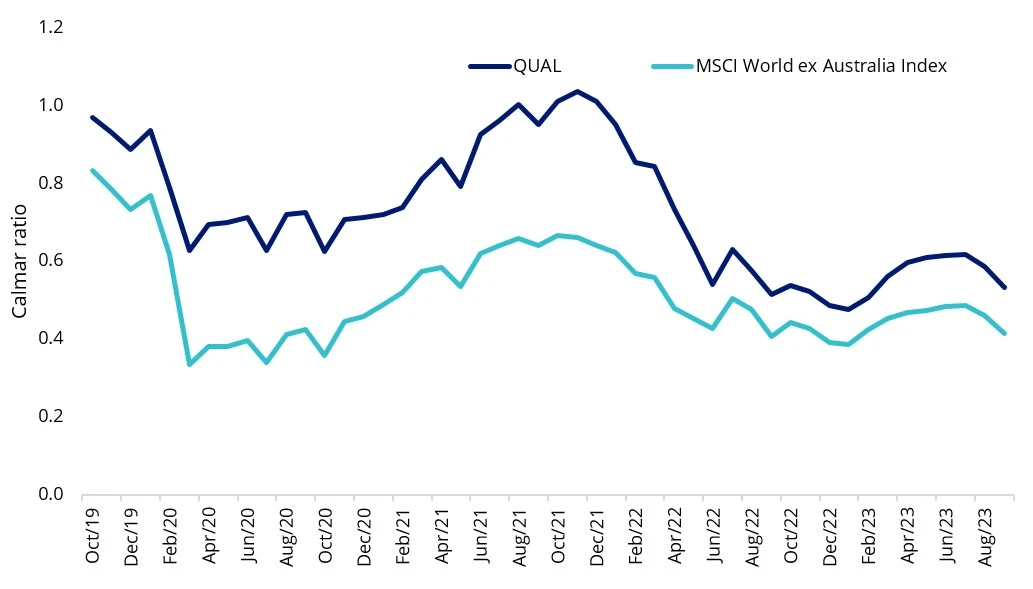
*Inception date is 29 October 2014. Source: Morningstar Direct, VanEck. The chart above shows the past performance of QUAL and of the MSCI World ex Australia Index. You cannot invest directly in an index. Results are calculated to the last business day of the month and assume immediate reinvestment of distributions. QUAL results are net of management fees and other costs incurred in the fund, but before brokerage fees and bid/ask spreads incurred when investors buy/sell on the ASX. Returns for periods longer than one year are annualised. Past performance is not a reliable indicator of future performance. The MSCI World ex Australia Index (“MSCI World ex Aus”) is shown for comparison purposes as it is the widely recognised benchmark used to measure the performance of developed market large- and mid-cap companies, weighted by market capitalisation. QUAL’s index measures the performance of 300 companies selected from MSCI World ex Aus based on MSCI quality scores, weighted by market cap x quality score at rebalance. Consequently QUAL’s index has fewer companies and different country and industry allocations than MSCI World ex Aus.
QUAL in the current environment
The fall in US rate expectations, most of which has happened in the past two weeks, has meant quality international companies, as represented by QUAL, has outperformed the broader share market since the beginning of the month. Noting that past performance should not be relied upon for future performance, we believe QUAL will be well positioned to further outperform into 2024 if interest rate expectations remain where they are and economies around the world experience a slowdown.
Since its inception on 29 October 2014, QUAL has returned 15.16% p.a., outperforming, the MSCI World ex Australia Index, by 2.95% p.a. (to 18 October 2023, source Morningstar).
Table 1: QUAL performance to 18 October 2023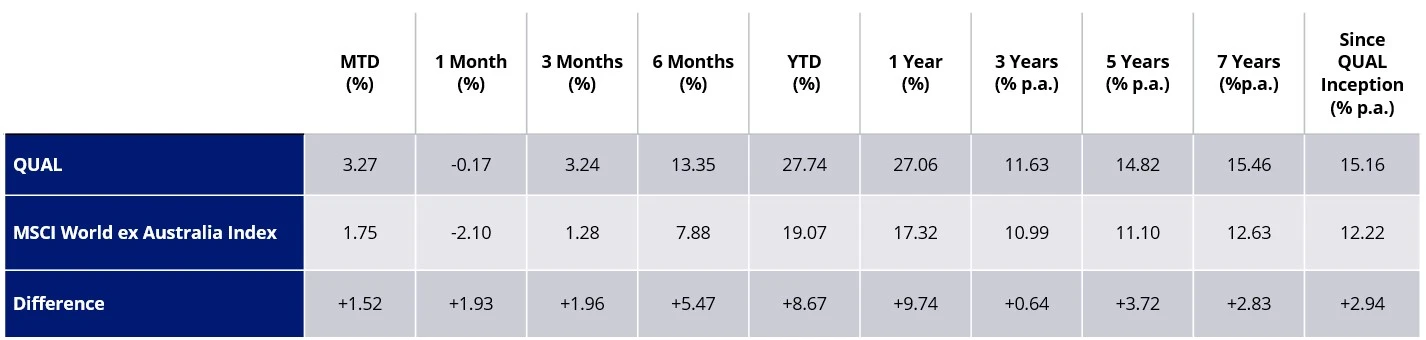
*Inception date is 29 October 2014. Source: Morningstar Direct, VanEck. The chart above shows the past performance of QUAL and of the MSCI World ex Australia Index. You cannot invest directly in an index. Results are calculated to the last business day of the month and assume immediate reinvestment of distributions. QUAL results are net of management fees and other costs incurred in the fund, but before brokerage fees and bid/ask spreads incurred when investors buy/sell on the ASX. Returns for periods longer than one year are annualised. Past performance is not a reliable indicator of future performance. The MSCI World ex Australia Index (“MSCI World ex Aus”) is shown for comparison purposes as it is the widely recognised benchmark used to measure the performance of developed market large- and mid-cap companies, weighted by market capitalisation. QUAL’s index measures the performance of 300 companies selected from MSCI World ex Aus based on MSCI quality scores, weighted by market cap x quality score at rebalance. Consequently, QUAL’s index has fewer companies and different country and industry allocations than MSCI World ex Aus.
When QUAL launched, it was the first smart beta international equity ETF on ASX. Since that time QUAL has been one of the best performing international equities strategies available to Australian investors. Smart beta is an approach that provides investors the best of both active and passive worlds:
- Active outcomes; and
- Passive fees and full transparency.
Active outcomes for low fees
The impressive performance noted above has been achieved for a fee of just 40bps, making QUAL one of the lowest cost managed funds in its peer group. As you can see below, QUAL’s low fee stands out among those managers that can boast outperformance over the past five and seven years to the end of February 2023. You can see most actively managed funds charge much higher fees, generally between 1% and 1.5%. What this means is that active managers have to outperform QUAL by at least the difference between their total fees (including performance fees) and QUAL’s lower fees to just break even with QUAL every year. You can see below despite these higher fees only a small percentage of funds have outperformed QUAL. Many underperform the benchmark over the long term, including some of the most popular international equities funds.
Chart 2: Global equity: Five year performance versus fees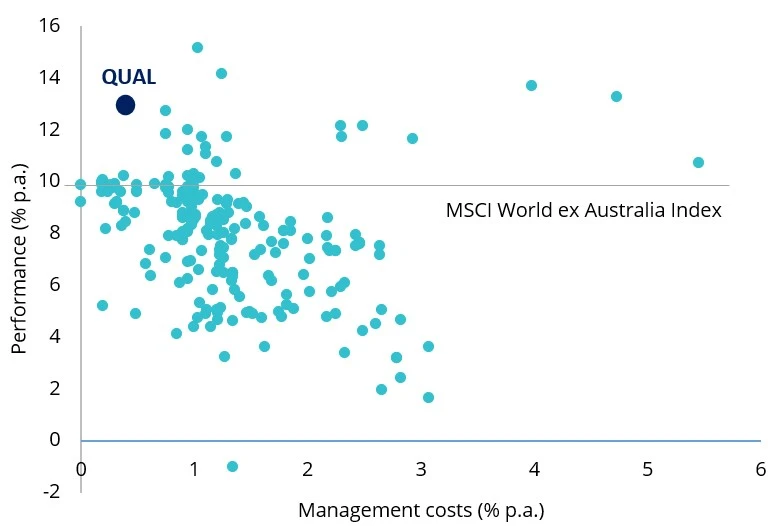
Chart 3: Global equity: Seven year performance versus fees 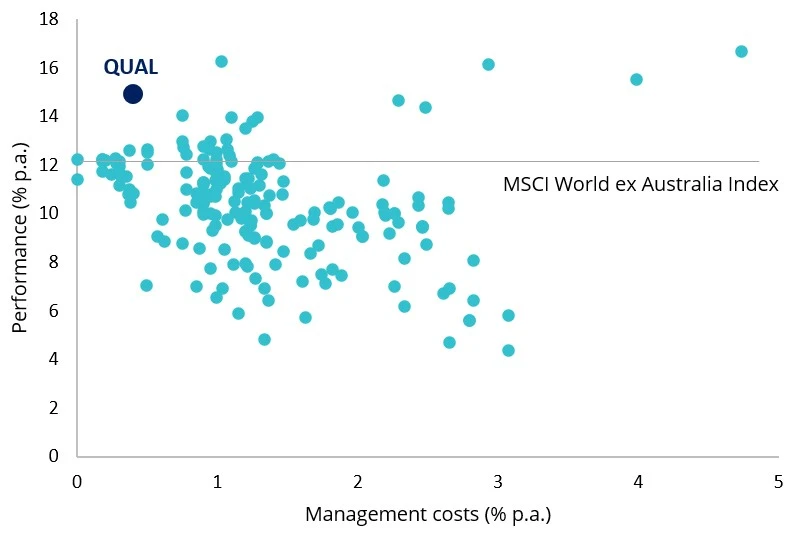
Source for chart 2 and 3: Morningstar, as at 30 September 2023. Past performance is not a reliable indicator of future performance. Results are net of management fees and other costs incurred in the fund, but before brokerage fees and bid/ask spreads. Returns for periods longer than one year are annualised. Past performance is not a reliable indicator of future performance. The peer group of Global Equities includes Morningstar’s Open Ended Global Equity Blend Category, Morningstar’s Open Ended Global Equity Growth Category and Morningstar’s Open Ended Global Equity Value Category which are based on the defined Australian universe of funds that invest primarily in large global companies. Management costs are Maximum Management Costs in Morningstar Direct and does not include performance fees.
Quality in contractions and slowdowns
To illustrate how the quality factor may perform in the current economic environment, in Chart 4 below we overlay the manufacturing activity (a proxy for economic activity) with the relative performance of quality (MSCI World Quality Index/MSCI World Index). In the chart below each economic regime is represented by a colour: recovery (blue), expansion (green), slowdown (orange) and contraction (purple).
Chart 4: US ISM Manufacturing PMI Index and relative MSCI World Quality performance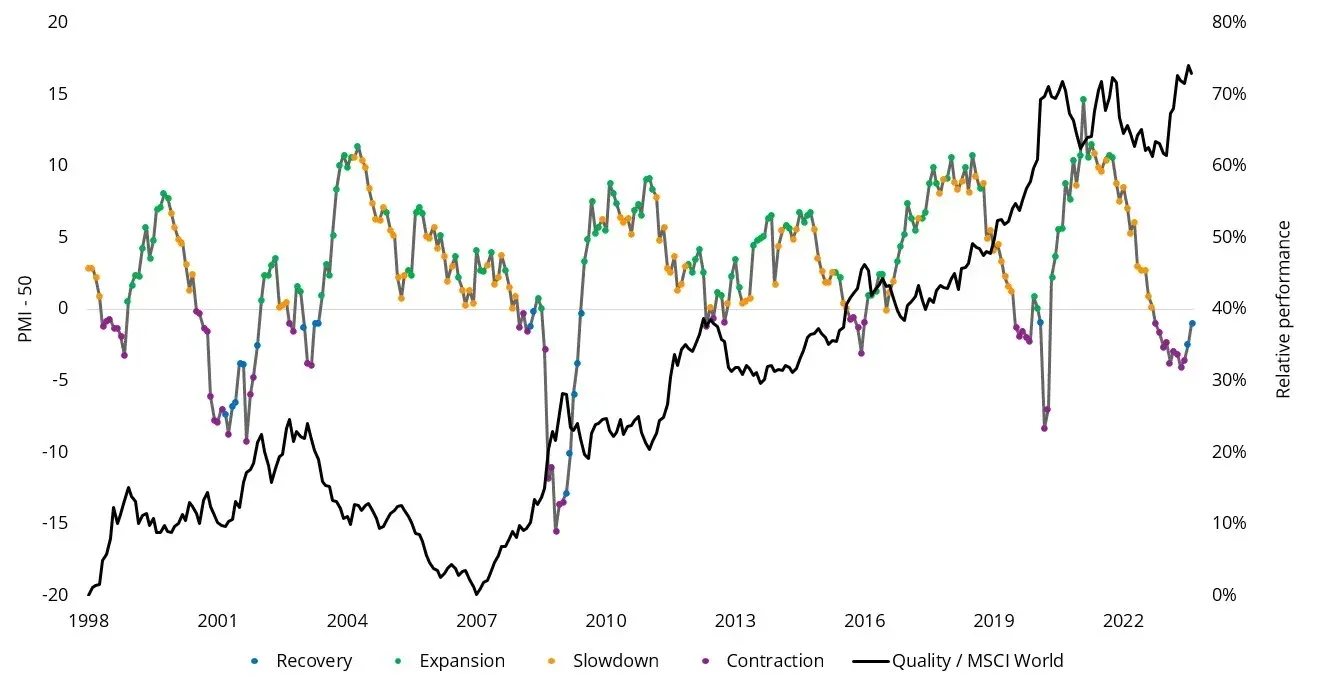
Source: Bloomberg, MSCI, September 2023. Past performance is not a reliable indicator of future performance. Quality and MSCI World represented by the MSCI World Quality Index and MSCI World Index respectively.
The dark grey line illustrates quality has outperformed over the long term, but also it is evident that quality had periods of outperformance and underperformance and that these tend to correlate to the economic cycle. The table below represents the returns of the quality factor through the cycle.
Table 2: Quality Factor performance during different economic regimes
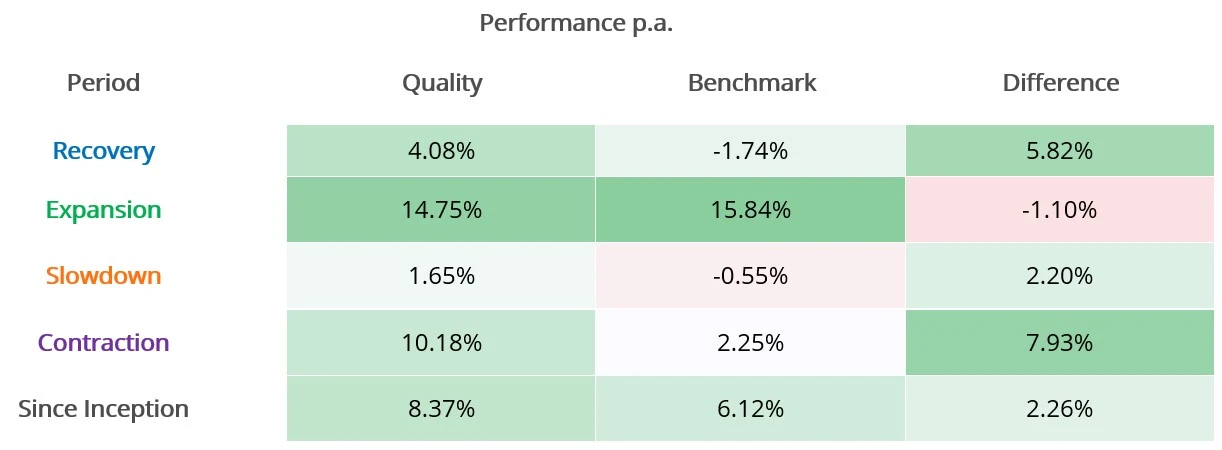
Source: Bloomberg, MSCI, September 2023. Past performance is not a reliable indicator of future performance. Quality and Benchmark represented by the MSCI World Quality Index and MSCI World Index respectively.
You can see that quality historically outperformed most during a contraction and subsequent recovery. As a result of these performance characteristics, the quality factor has earned the reputation as being a ‘defensive factor’. Quality companies have dependable earnings and are lowly leveraged, so they are able to better withstand the extremes of the economic cycle. Though we would always caution, past performance is not indicative of future performance.
It is challenging for investors to navigate economic conditions and prevailing markets. ETFs that capture the factors outlined are being used by savvy investors as tools, to either hold through the cycle, or blend, to help mitigate the troughs of the cycle.
We recently refreshed a microsite to help investors understand the quality factor – click here.
Key risks: An investment in QUAL carries risks associated with: ASX trading time differences, financial markets generally, individual company management, industry sectors, foreign currency, country or sector concentration, political, regulatory and tax risks, fund operations and tracking an index. See the PDS for details.


Published: 24 October 2023
Any views expressed are opinions of the author at the time of writing and is not a recommendation to act.
VanEck Investments Limited (ACN 146 596 116 AFSL 416755) (VanEck) is the issuer and responsible entity of all VanEck exchange traded funds (Funds) listed on the ASX. This is general advice only and does not take into account any person’s financial objectives, situation or needs. The product disclosure statement (PDS) and the target market determination (TMD) for all Funds are available at vaneck.com.au. You should consider whether or not an investment in any Fund is appropriate for you. Investments in a Fund involve risks associated with financial markets. These risks vary depending on a Fund’s investment objective. Refer to the applicable PDS and TMD for more details on risks. Investment returns and capital are not guaranteed.