The ‘size’ effect
Small companies, many pundits agree, could be the place to be in 2025. Internationally, US small caps have rallied since Trump’s win. But small cap investing is not without risks. Selectivity is key.
This year, the Australian Financial Review has had numerous articles and opinion pieces suggesting that small caps could be the place to be. This has intensified since Trump was elected to be the next US President. Headlines have included, Trump rally carries US small-cap stocks to all-time high and ASX small-cap investment due to rebound.
Extra risk has always been associated with small-cap investing but it has also long been associated with extra potential growth. This extra growth, beyond large caps, is supported by academic research. In 1981, Banz* found that “smaller firms (firms with low market capitalisation) have higher risk-adjusted returns than large firms on average”.
In investing this became known as the ‘size’ effect. This effect is observable in the historical long-term performance of many global equity benchmarks. In Australia, however, small companies have consistently underperformed their large- and mid-cap counterparts.
We think there is a way to harness the size effect locally. Like investing offshore, selectivity is key.
Defining small companies
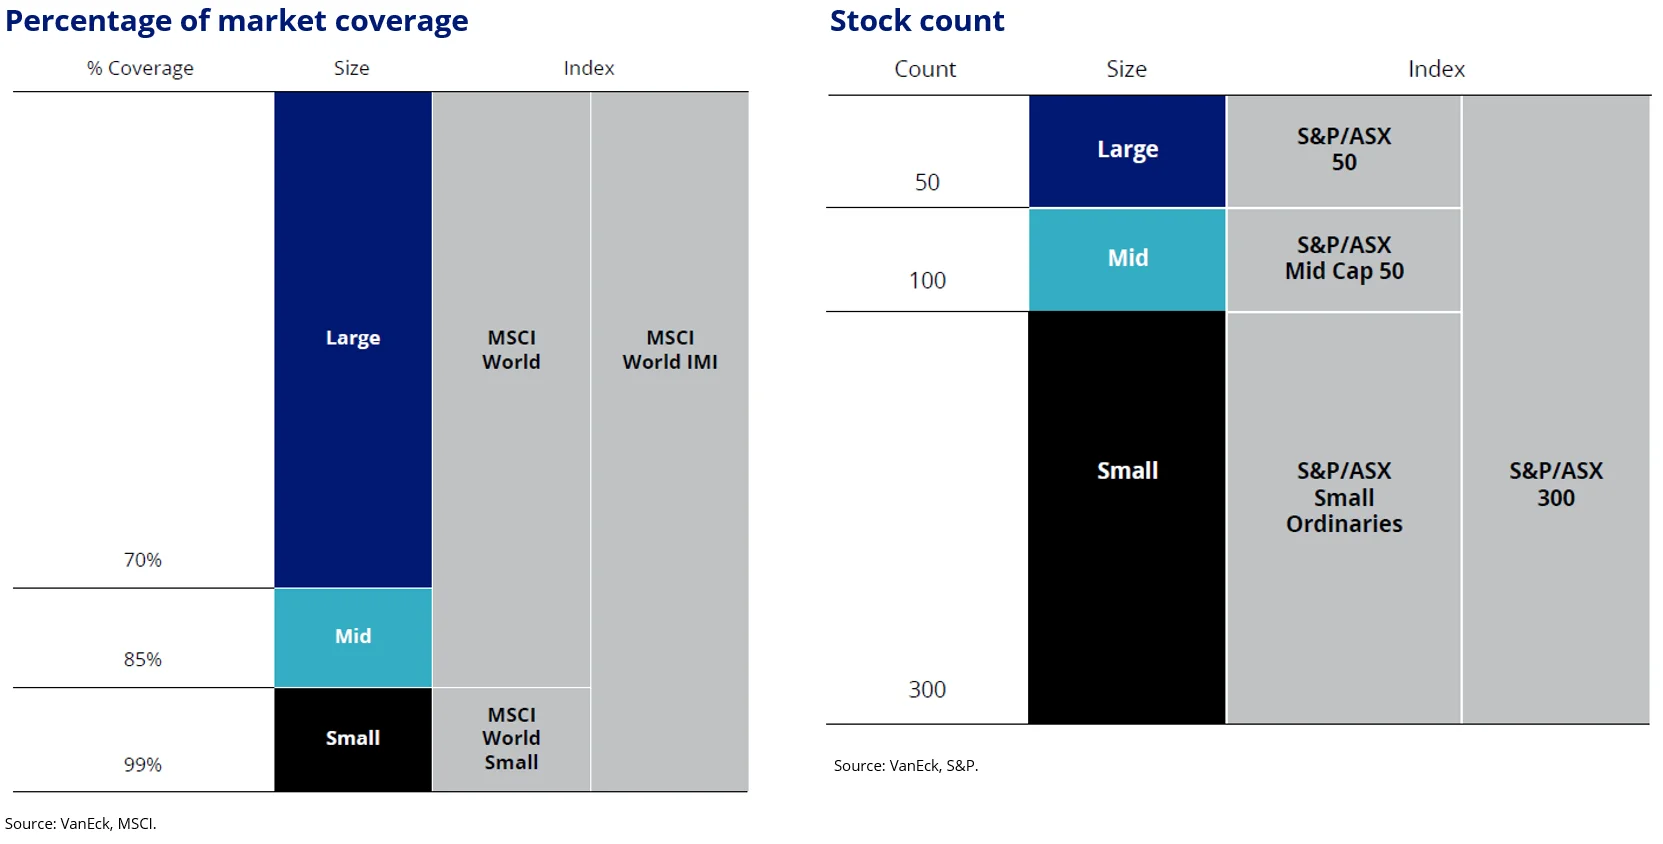
First, let’s break down what small-caps are. The definition of a ‘’small-cap” is often determined by any of the following criteria:
- Absolute level of market capitalisation, for example, <A$1 billion;
- Percentage of market coverage, for example, companies in the smallest percentage of total market capitalisation above a minimum size threshold, for example, the MSCI World Small Cap index;
- Stock count, for example, a set number of companies by market capitalisation ranking such as the S&P/ASX Small Ordinaries (Small Ords) which is stocks 101 to 300.
Figure 1: Examples of small-companies’ determinations
Source: VanEck, MSCI
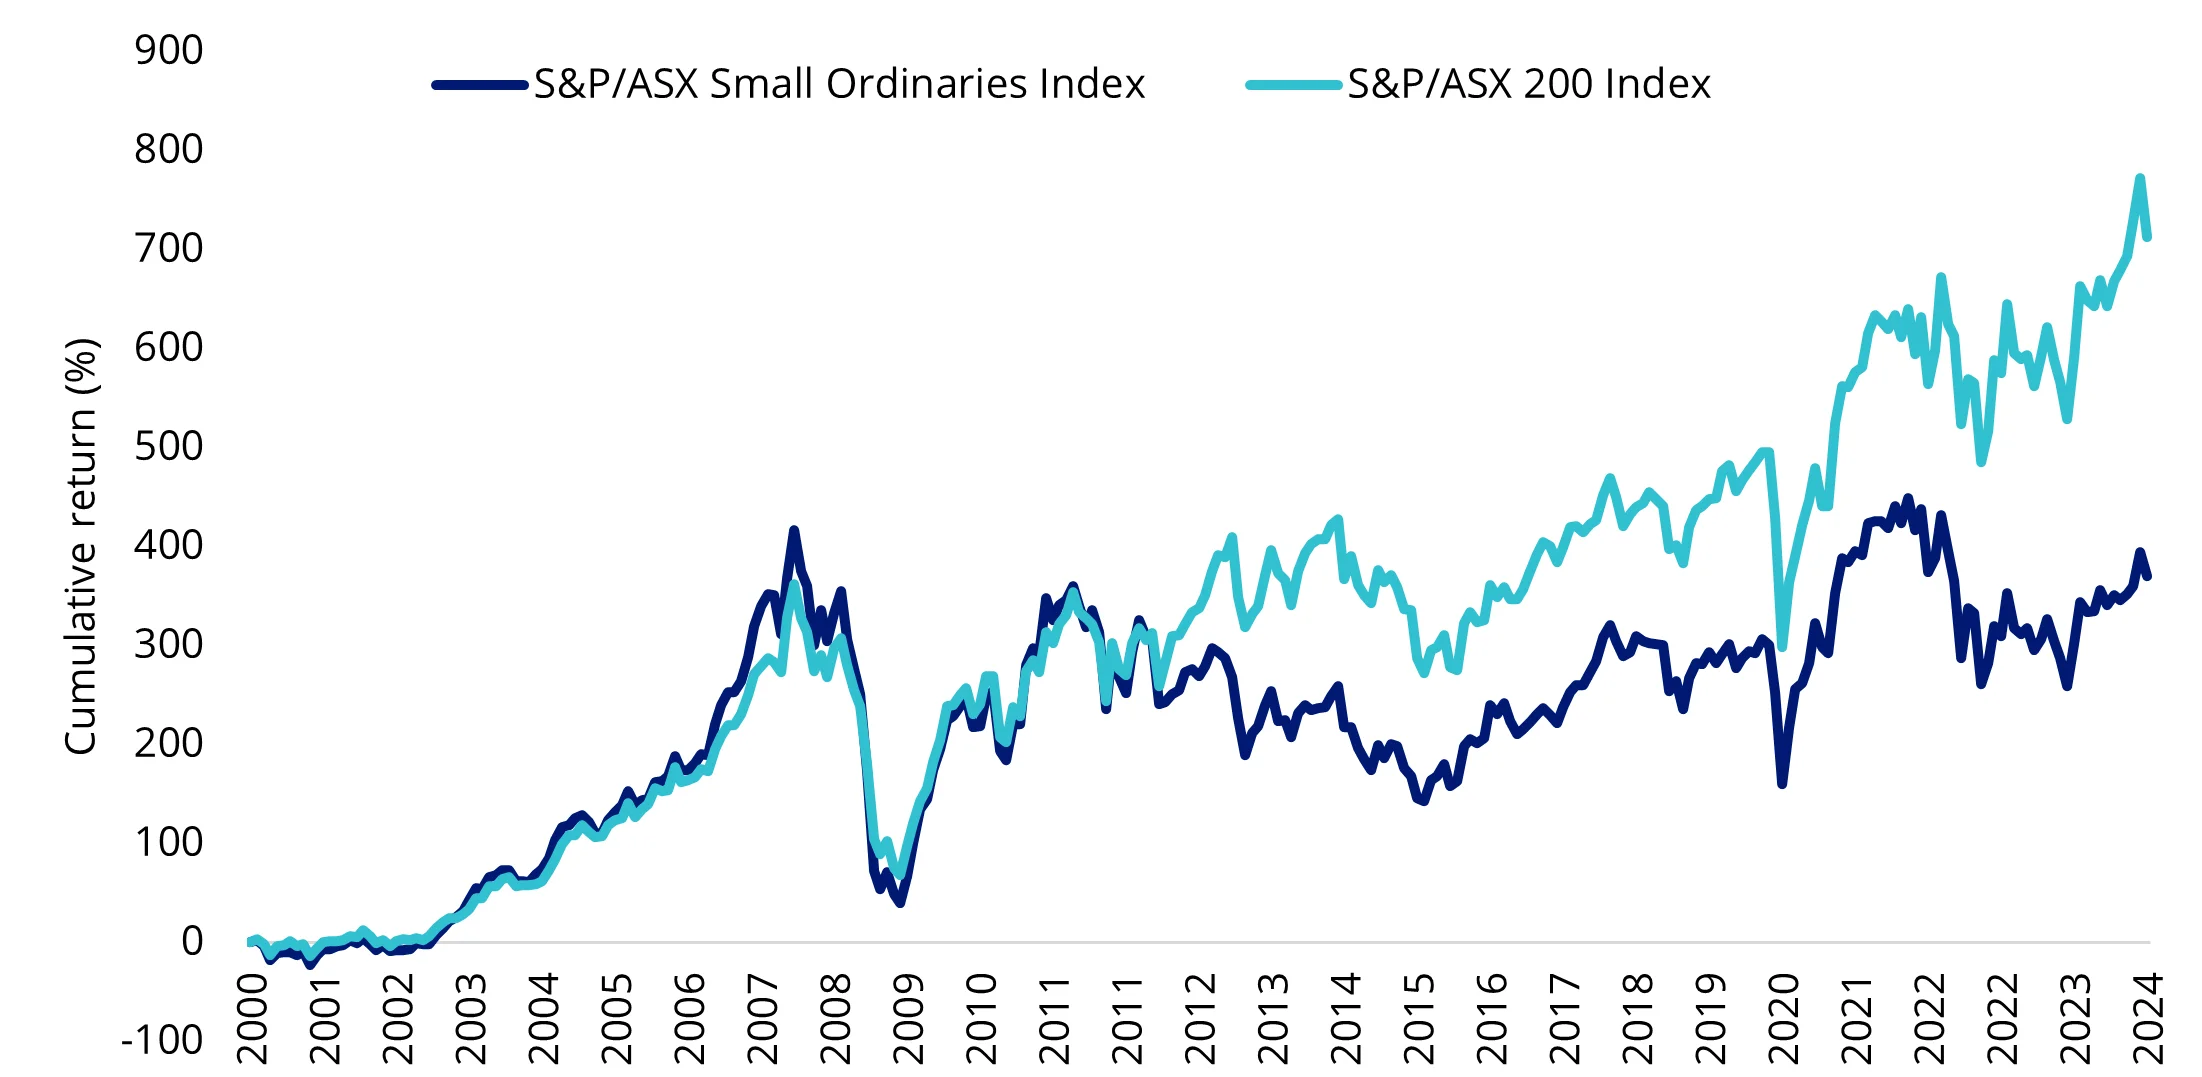
As noted above, the lure of growth, or the ‘size’ effect, has attracted local investors to Australian small caps. But Australian small companies, as represented by the Small Ords have consistently underperformed their large- and mid-cap counterparts.
The Small Ords has delivered lower cumulative returns relative to the broader Australian equities benchmark, the S&P/ASX 200, since the S&P/ASX Index series started in 2000.
Figure 2: Cumulative historical performance of Australian small-caps and broad Australian equity benchmark
Source: Morningstar Direct, S&P. 31 December 2000 to 31 October 2024. Past performance is not indicative of future performance. You cannot invest in an index.
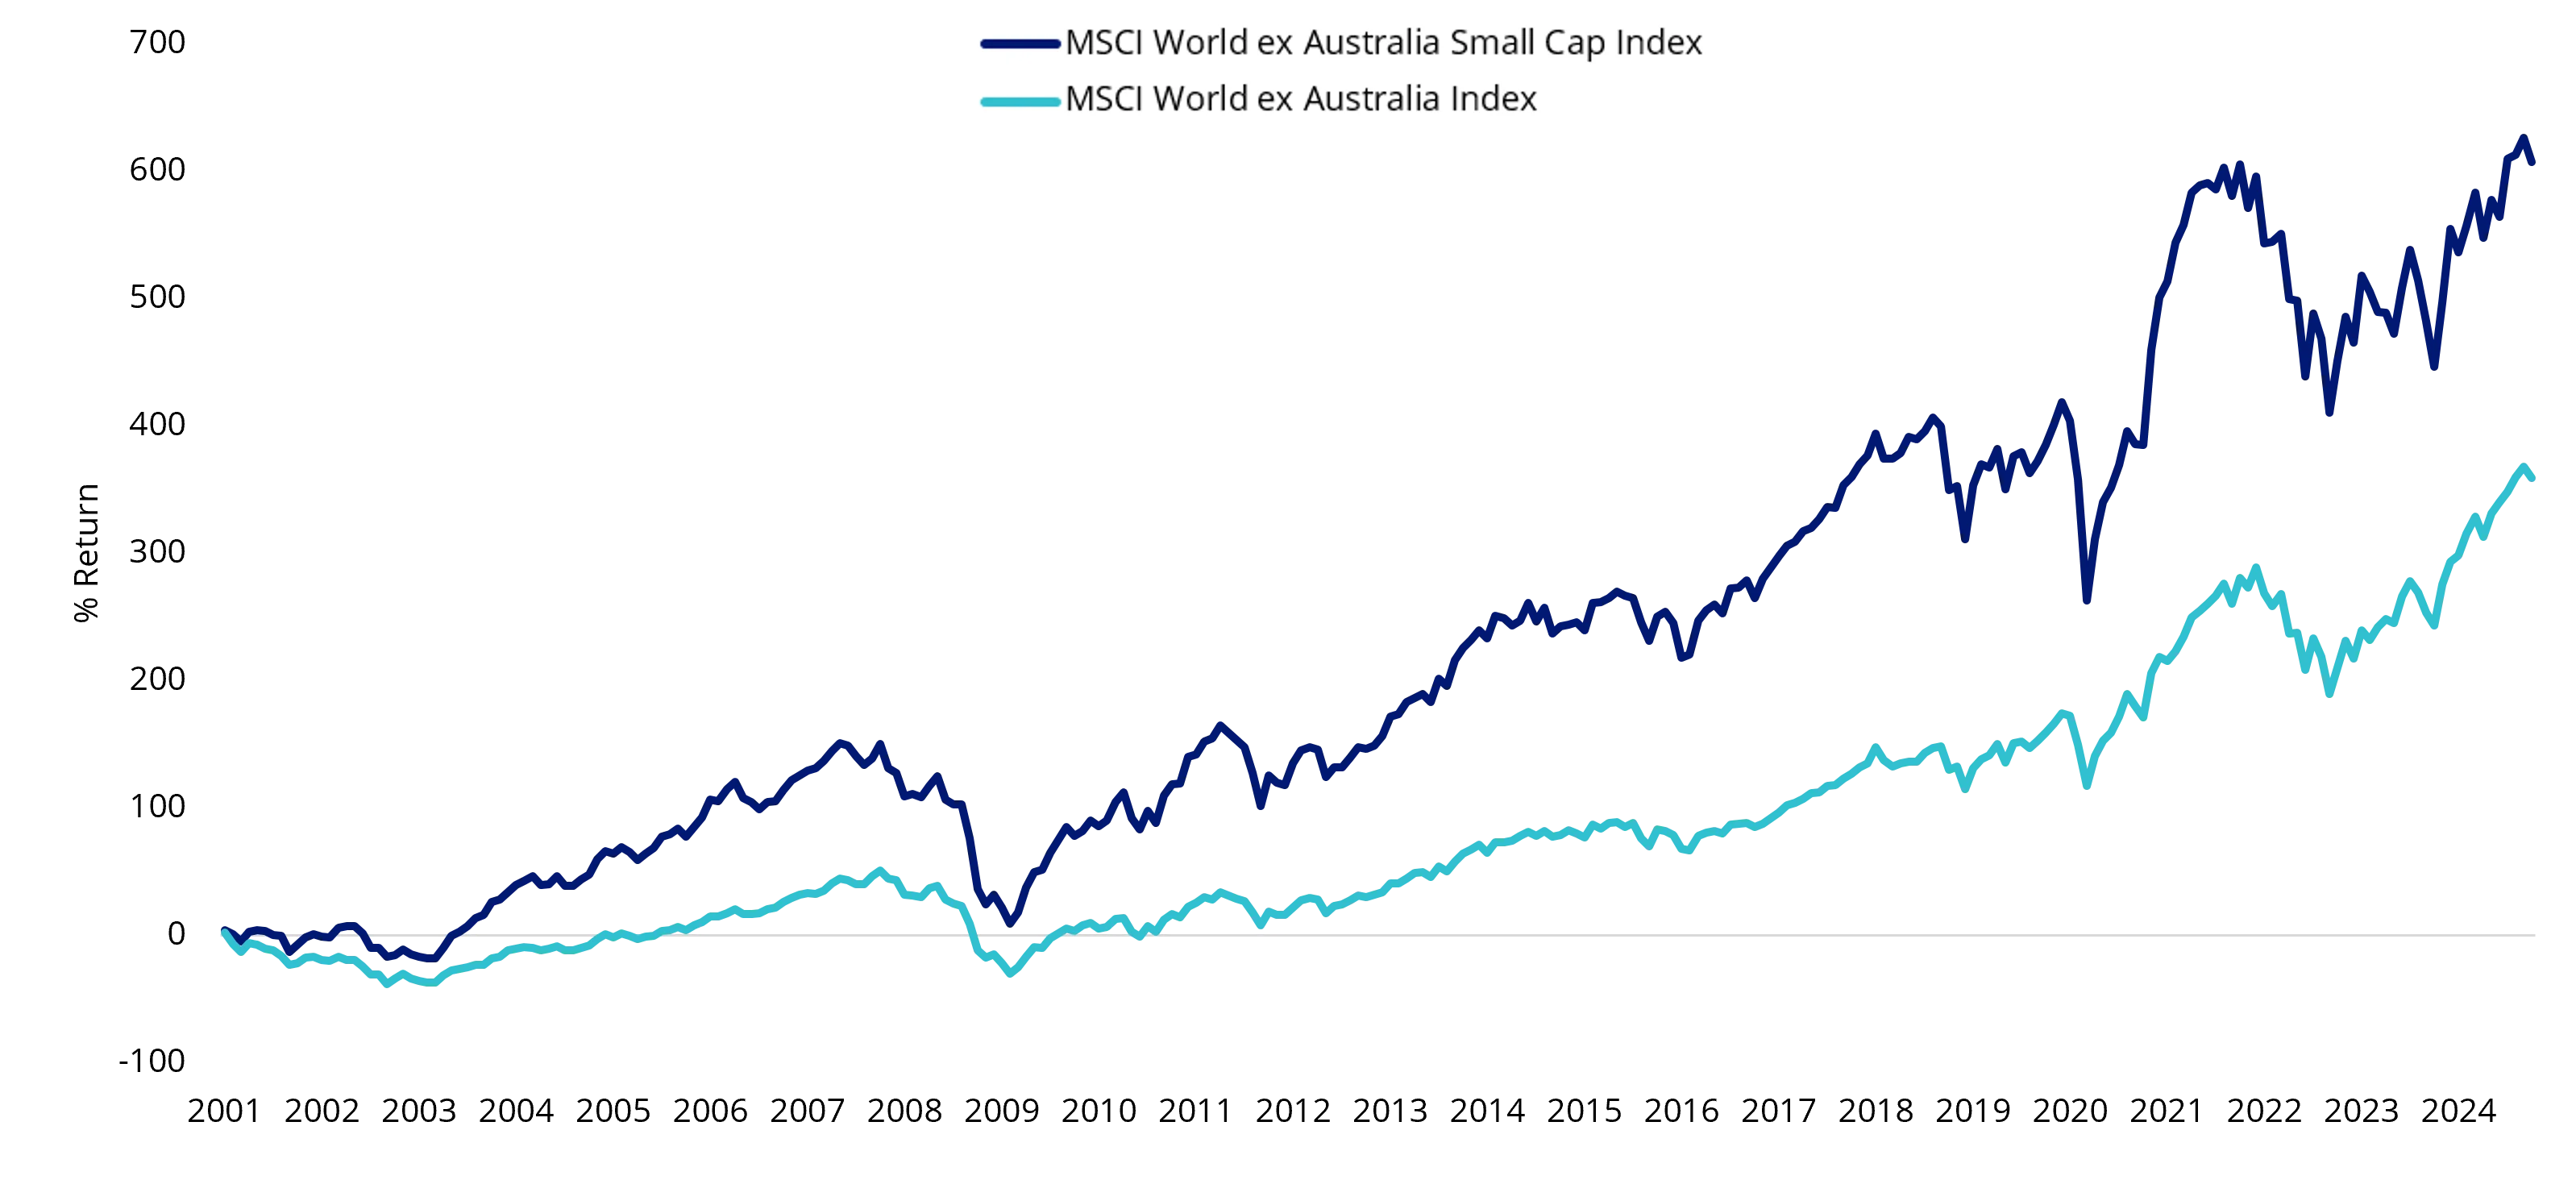
Unlike Australian small companies, global smaller caps have historically demonstrated outperformance relative to large companies over the long term. Below is the cumulative performance of the large-cap MSCI World ex Australia versus MSCI World ex Australia Small Cap index.
Figure 3: Cumulative historical performance of international small-caps and broad international benchmarks
Source: Morningstar Direct, MSCI. 31 December 2000 to 31 October 2024, returns in AUD terms. Past performance is not indicative of future performance. You cannot invest in an index.
While the outcomes of investing in small companies differ depending on where you invest, we think harnessing the ‘size’ effect is possible in both international and Australian markets. The key is selectivity.
First, let’s look at international equities.
Global small company investing
Local investors might be surprised to learn that global small-caps, in the context of market size, would be characterised as mid-caps in Australia when measured by market capitalisation.
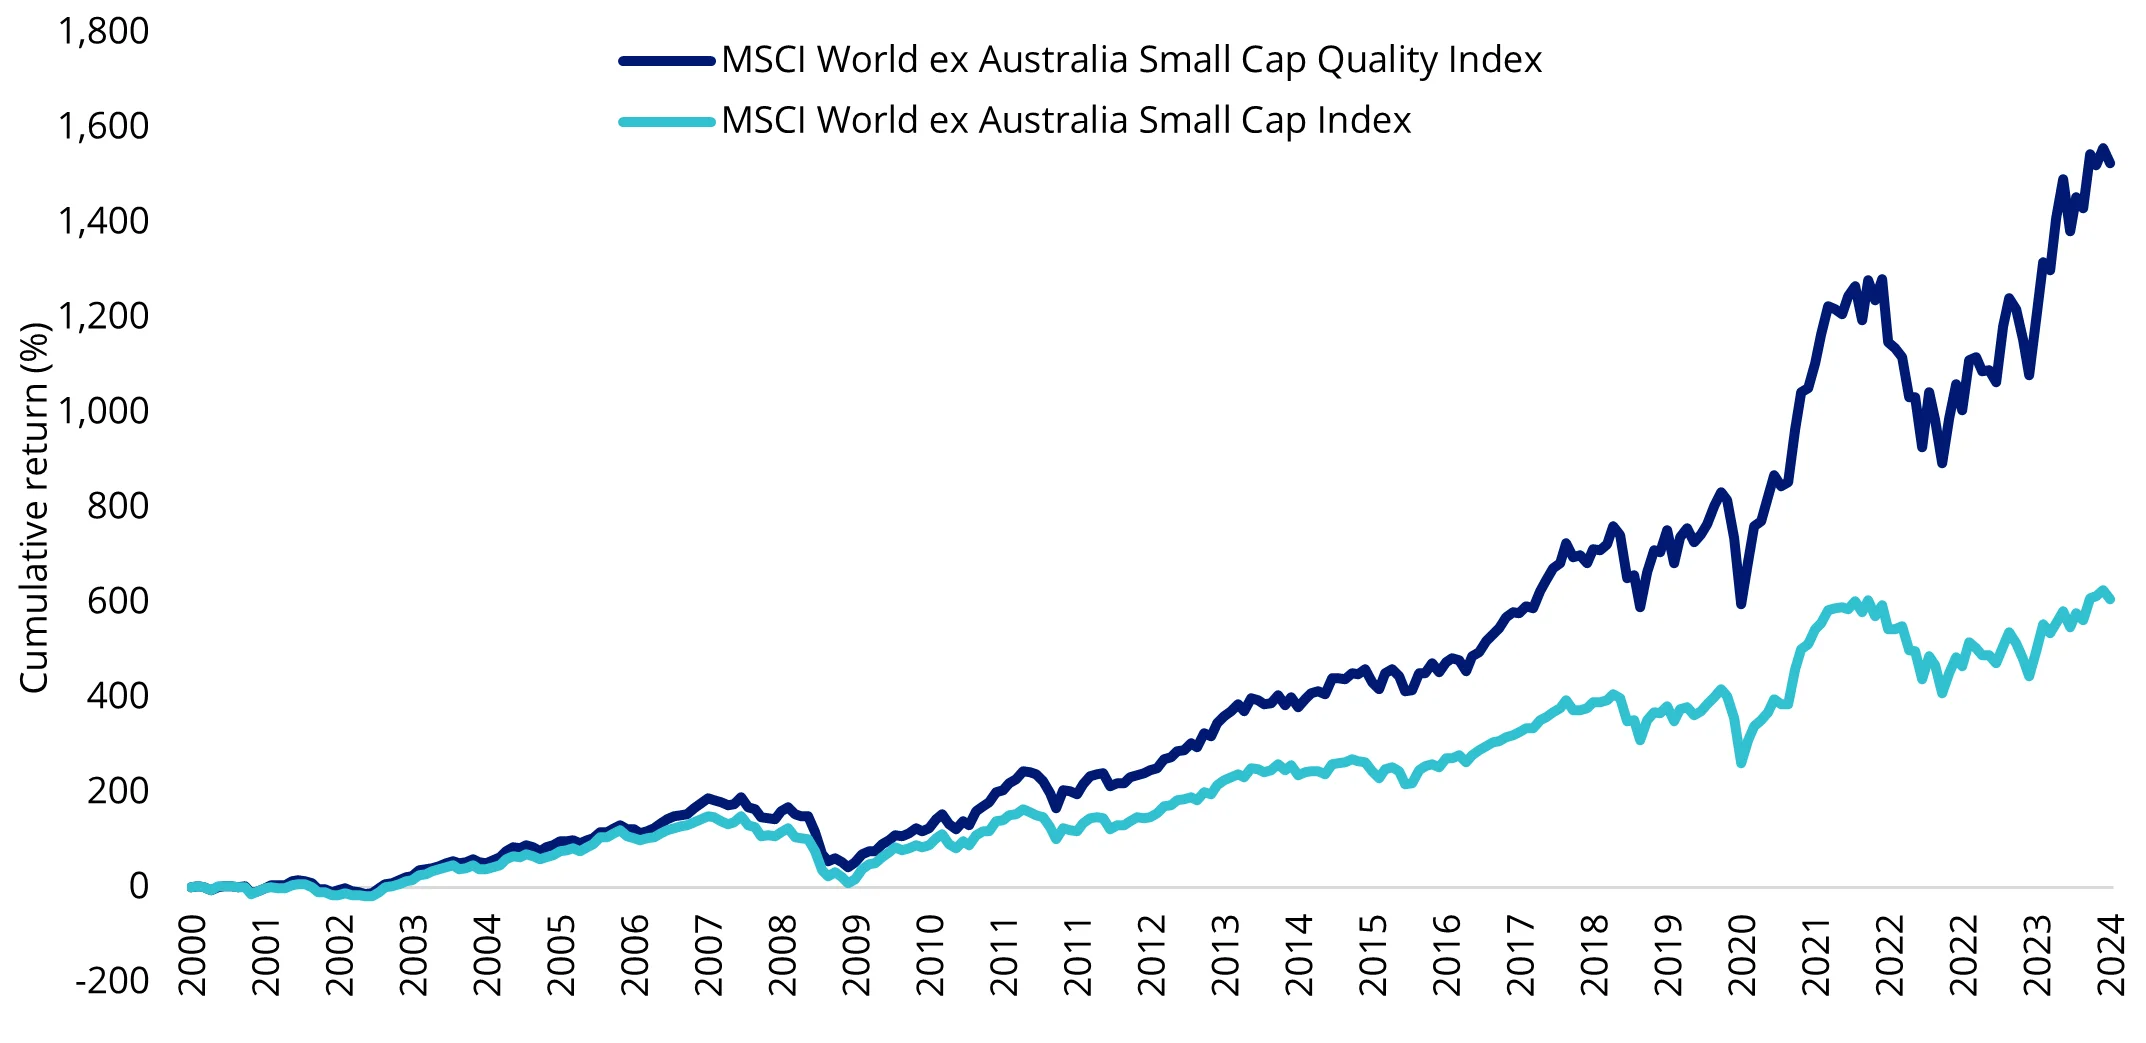
There are over 4,000 companies in the global small-cap universe, and many are undesirable from an investment perspective. One approach that has shown historical outperformance in the large and mid-cap universe while offering defensive characteristics is ‘quality’. This approach can also be used to identify small-cap companies which have a strong financial position and the ability to maintain earnings.
Last year we released a research paper Global small-caps: An overlooked opportunity, highlighting that the outperformance of quality international small companies (relative to the international small companies index) is higher than the outperformance of quality international large companies (relative to the international large companies index). These findings supported earlier research of Economist Robert Novy-Marx’s who asserted that quality small companies are able to generate higher relative returns than quality larger companies.
Figure 4: Cumulative historical performance of the international quality small-caps and international small cap benchmarks
Australian small company investing
As noted above, Australian small companies are much smaller, by size, than global small companies. You can see this in the chart below, all companies in the index are below $5 billion in free float market capitalisation.
Figure 5: Index coverage by market capitalisation
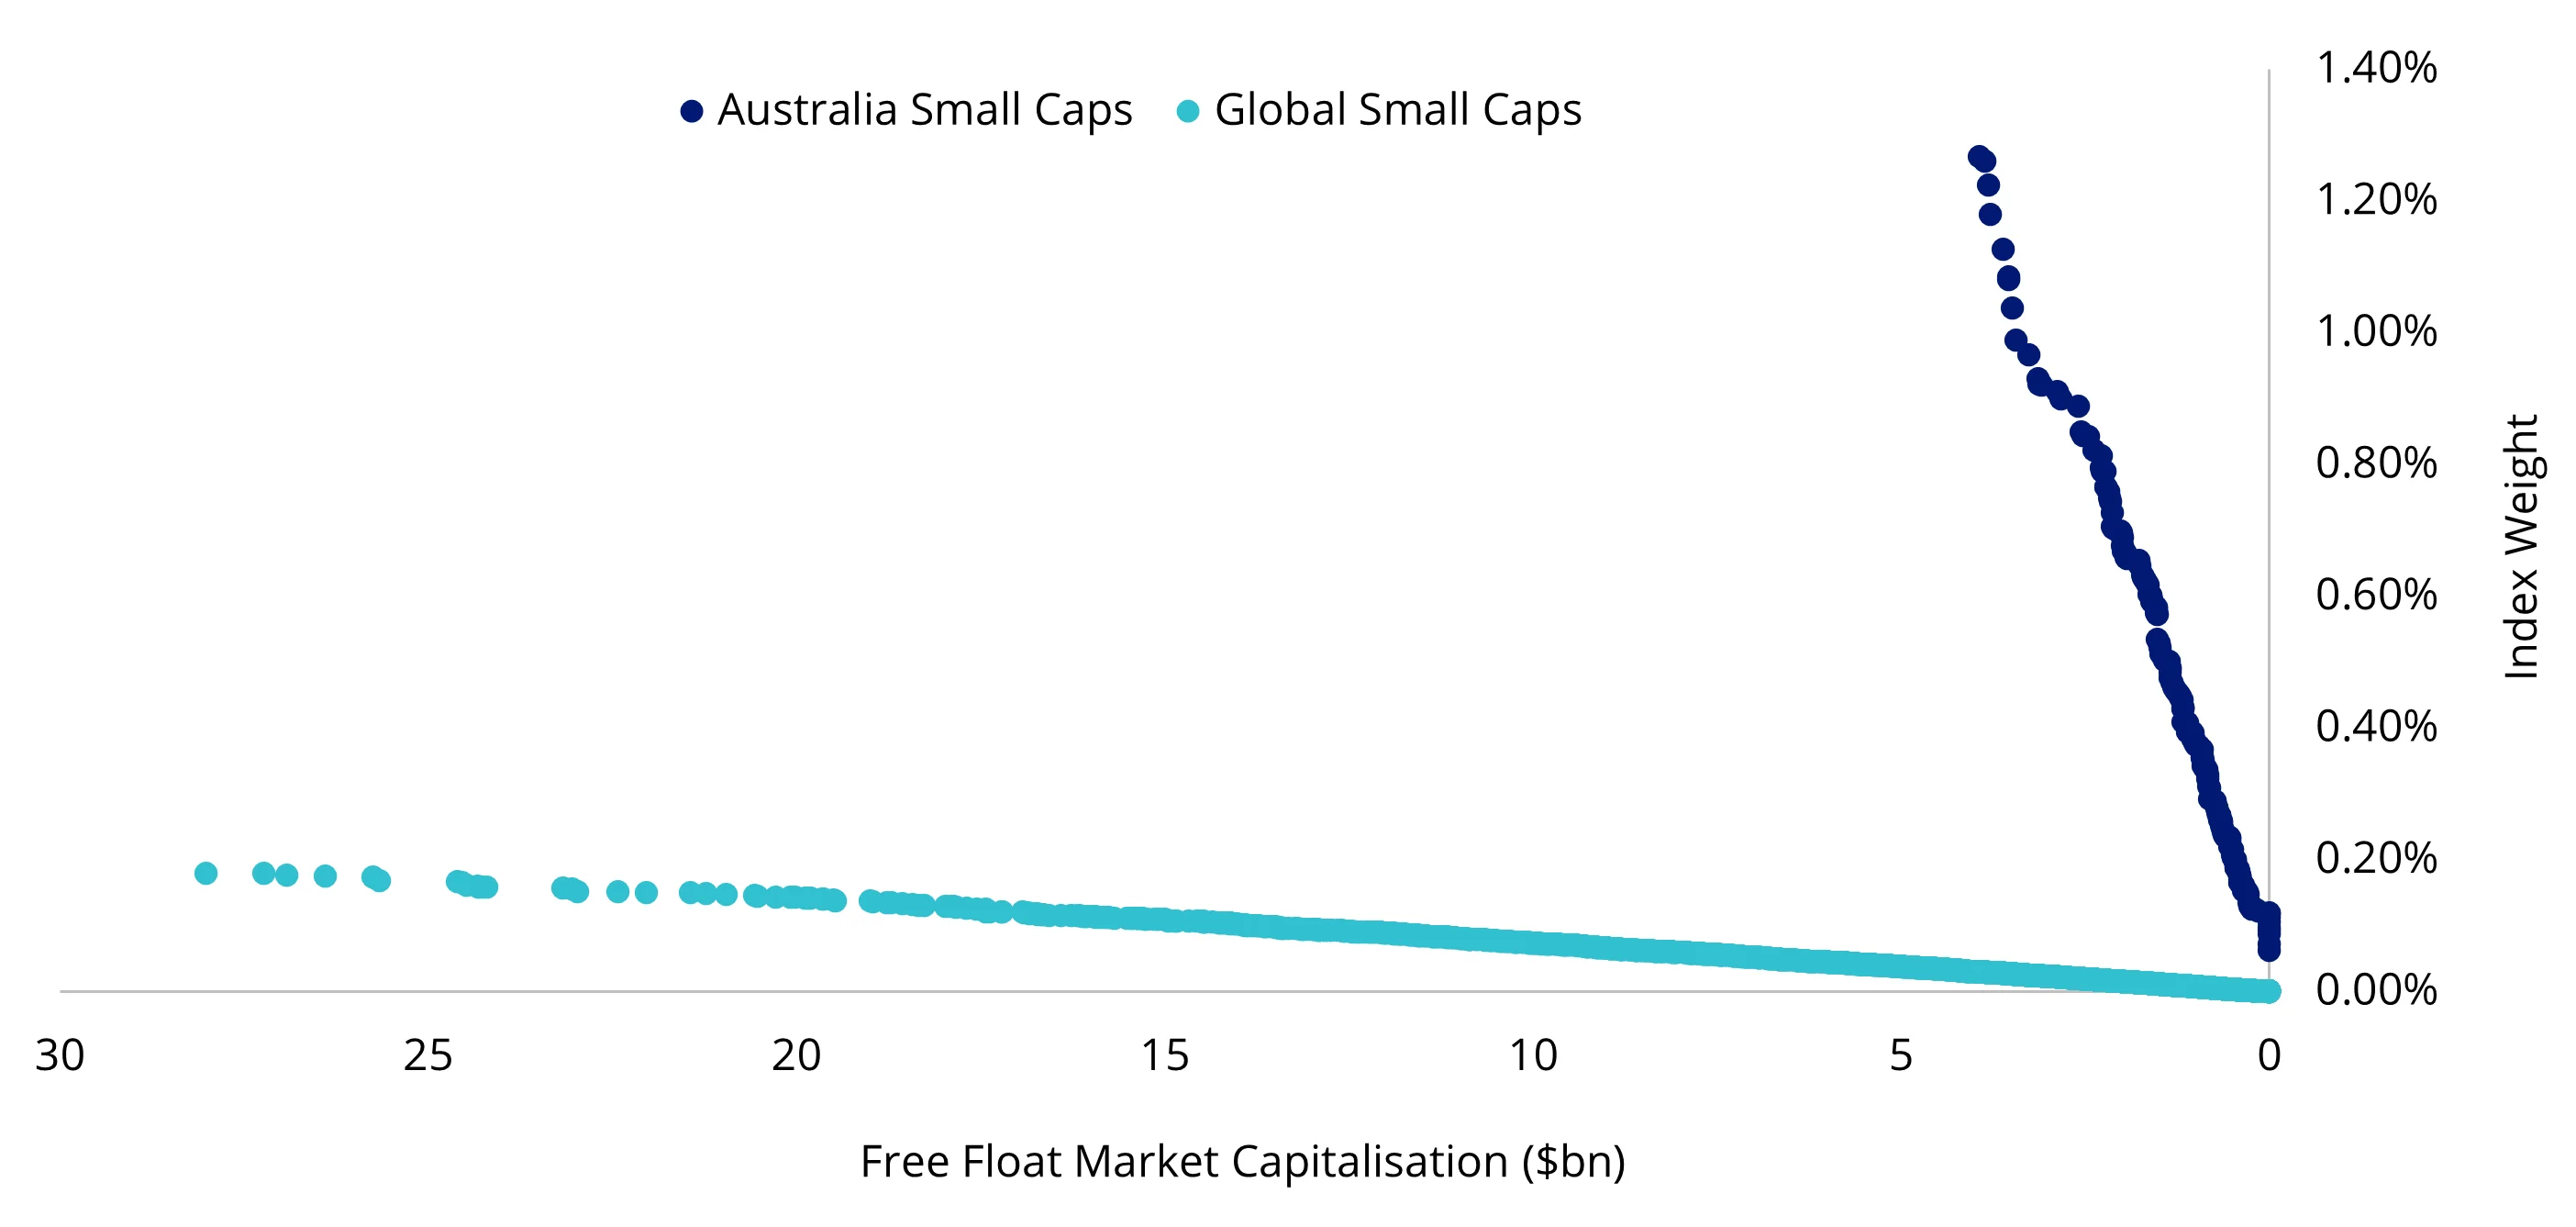
Source: S&P, MSCI, as at 31 October 2024. Australian Small Caps is S&P/ASX Small Ordinaries Index, Global Small Caps is MSCI World ex Australia Small Caps Index.
This lower size comes with increased risks. This could also be one of the reasons the Small Ords, underperforms the large-cap dominated S&P/ASX 200 Index.
The higher average market capitalisation of global small-caps relative to Australian small-caps implies that these companies are more established businesses in the ‘growth’ phase of the business cycle. Australian small-caps by comparison have a higher proportion of companies in the ‘introduction’ phase, meaning that sales and earnings growth are likely to be more mixed, with a shorter track record.
Figure 6 & 7: EPS growth comparison, Listing date comparison
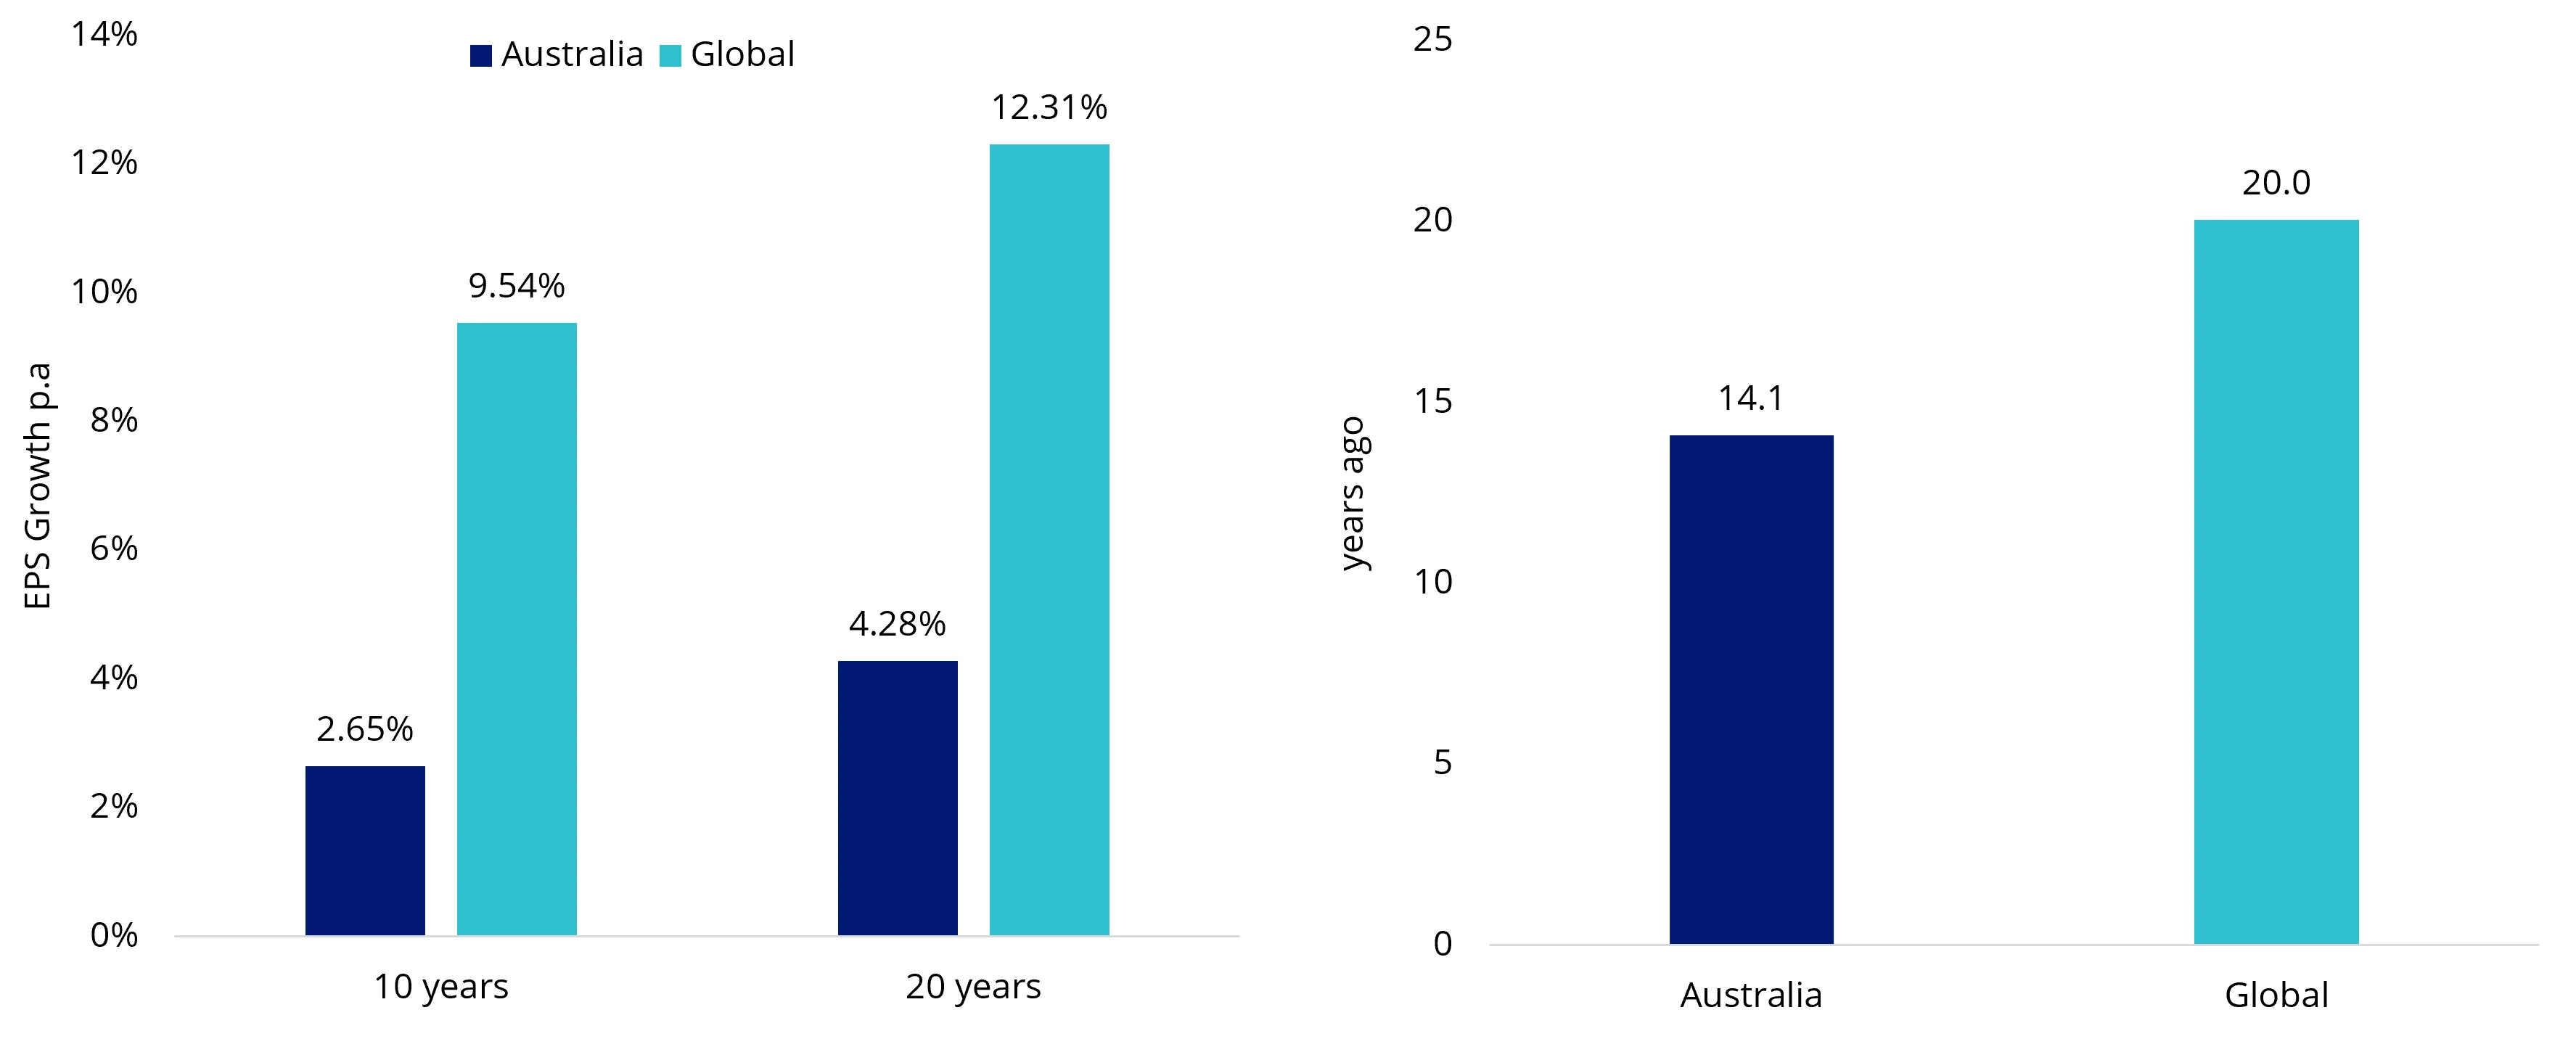
Figure 6 & 7 source: Bloomberg, as at 31 October 2024. Australia as S&P/ASX Small Ordinaries, Global as MSCI World ex Australia Small Cap. Past performance is not indicative of future performance.
Moreover, offshore exchanges have stricter rules around profitability and financial viability requirements for listing. Weaker listing requirements at home mean Australian small-caps have almost double the exposure to non-profitable companies, compared to global.
The largest Australian small-cap sector is materials. In the global small-cap index, it is one of the smallest sectors. Many small unprofitable mining companies on the Australian stock exchange are in the ‘infant’ stage of the business cycle to raise capital for exploration or mine development where debt and private equity financing are unavailable.
Figure 8: Percentage of unprofitable small-cap companies by index weight
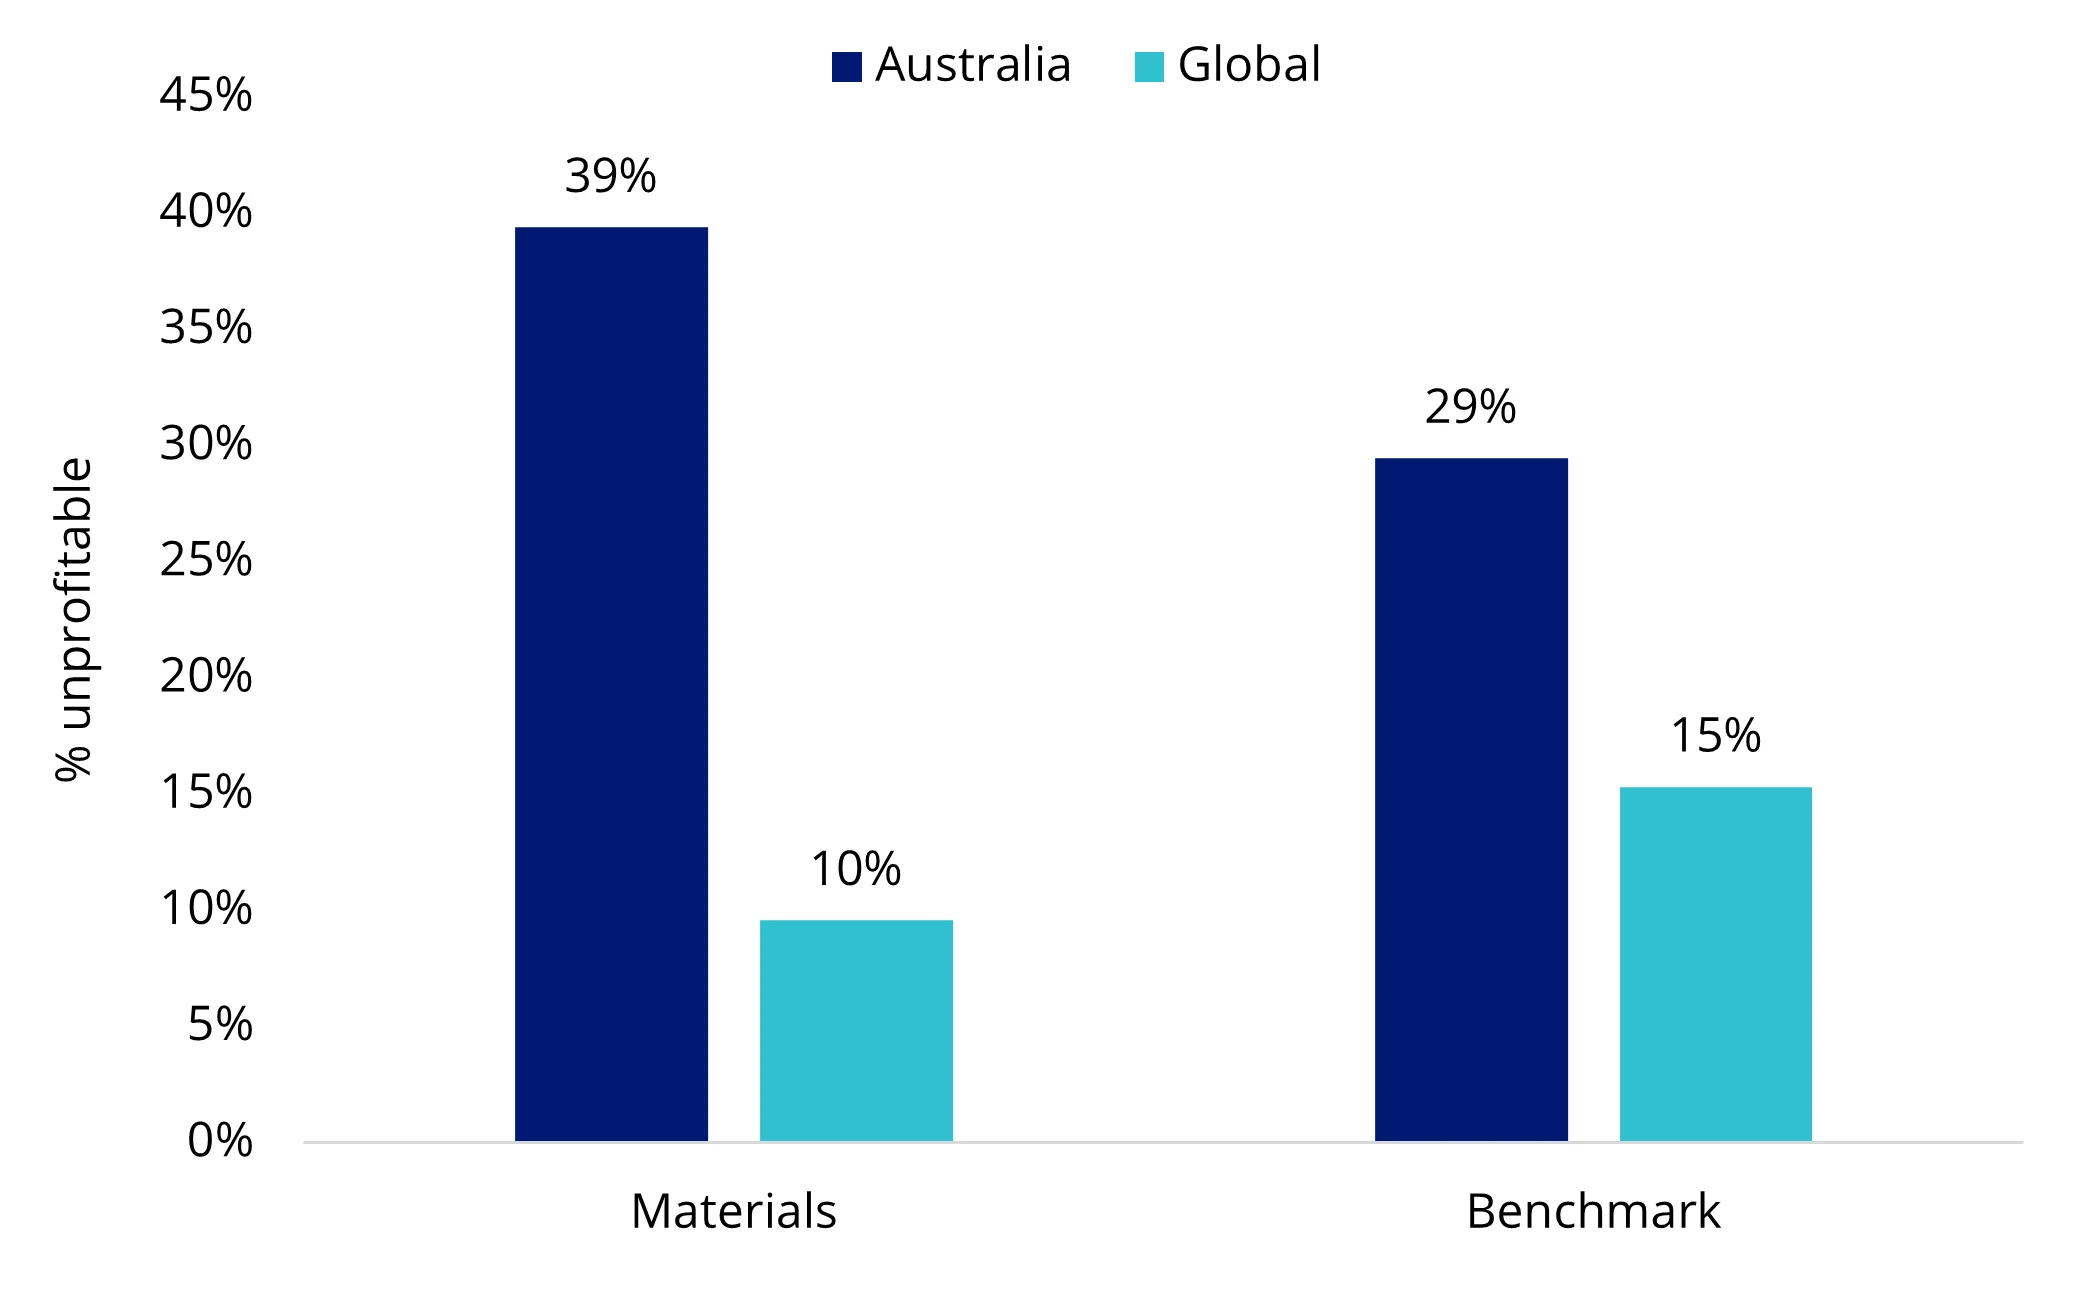
Source: Bloomberg, as at 31 October 2024. Australia is S&P/ASX Small Ordinaries, Global is MSCI World ex Australia Small Cap.
The efficacy of a ‘factor’ approach, like the quality approach noted above, would be difficult to implement for Australian small companies because of the sector and stock concentration that is a feature of Australian equities. Selectivity is key and many Australian active small companies managers have been able to outperform the Small Ords and thus take advantage of the size effect.
Among the analyses that active small company managers undertake is a review of the potential for a company to grow. They also assess profitability and cash flows. Of course, they are also wary of not overpaying for a company, so look for value. This type of analysis is a growth at a reasonable price. In the industry the jargon for this is GARP.
GARP analysis has typically been the domain of active managers.
That has been changing. Innovations in index design allow ETFs to track indices created using many tools active managers use to assess companies, such as a GARP analysis.
This approach is one way Australian investors could access the size effect.
As noted earlier, many pundits predict small companies will have many tailwinds in 2025, both here and abroad.
We would say, however, that selectivity is key.
Published: 29 November 2024
Any views expressed are opinions of the author at the time of writing and is not a recommendation to act.
VanEck Investments Limited (ACN 146 596 116 AFSL 416755) (VanEck) is the issuer and responsible entity of all VanEck exchange traded funds (Funds) trading on the ASX. This information is general in nature and not personal advice, it does not take into account any person’s financial objectives, situation or needs. The product disclosure statement (PDS) and the target market determination (TMD) for all Funds are available at vaneck.com.au. You should consider whether or not an investment in any Fund is appropriate for you. Investments in a Fund involve risks associated with financial markets. These risks vary depending on a Fund’s investment objective. Refer to the applicable PDS and TMD for more details on risks. Investment returns and capital are not guaranteed.


