Positioning portfolios as cyclical recovery hopes fade
Paying attention to the economic business cycle can help inform investment decisions. Currently in a ‘late cycle’ phase, we explore if the global economy is transitioning to an ‘early cycle’ environment.
Between March and May this year, asset classes that thrive during economic acceleration—such as commodities, energy stocks, value, and small companies—enjoyed strong price performance. However, recent weeks have seen hopes dashed for a cyclical recovery, as markets scaled back US rate cut expectations due to persistent high inflation prints. Investors not wishing to sit on the fence face the question of how to position their portfolios.
Chart 1: 2024 global performance comparison
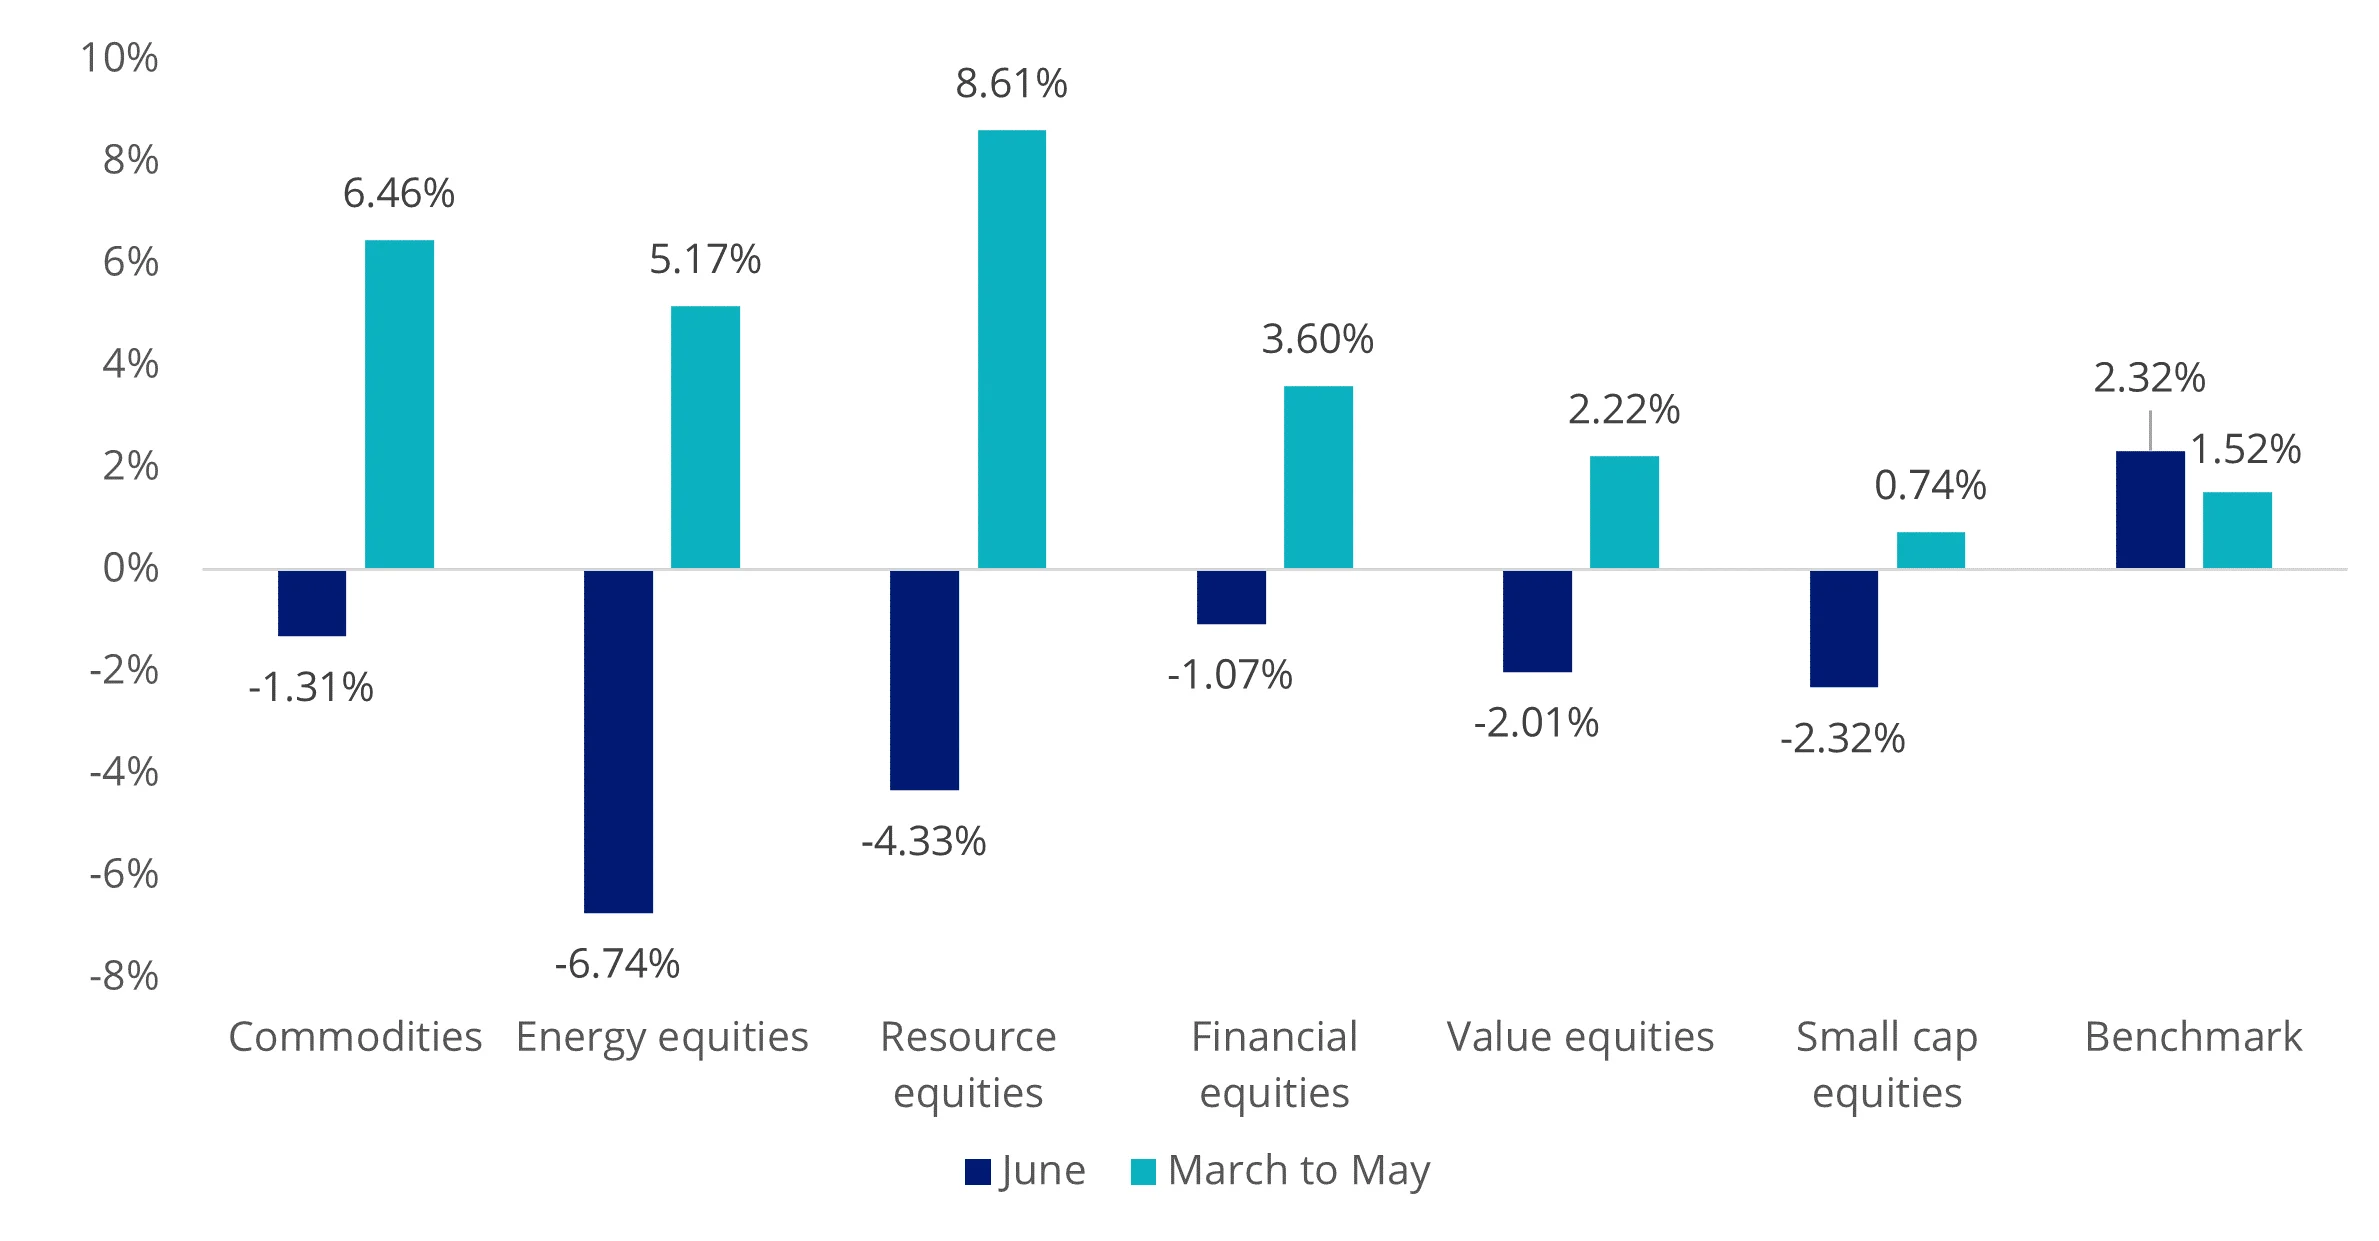
Source: Bloomberg, AUD returns, Commodities as Bloomberg Commodity Spot Index, Energy equities as S&P Global Energy Index, Resource equities as S&P Global Natural Resources Index, Financial equities as MSCI World Financials Index, Value equities as MSCI World Enhanced Value, Small cap equities as MSCI World Small Cap Index, Benchmark* as MSCI World Index.
Chart 2: US rate cut expectations by Dec 2024
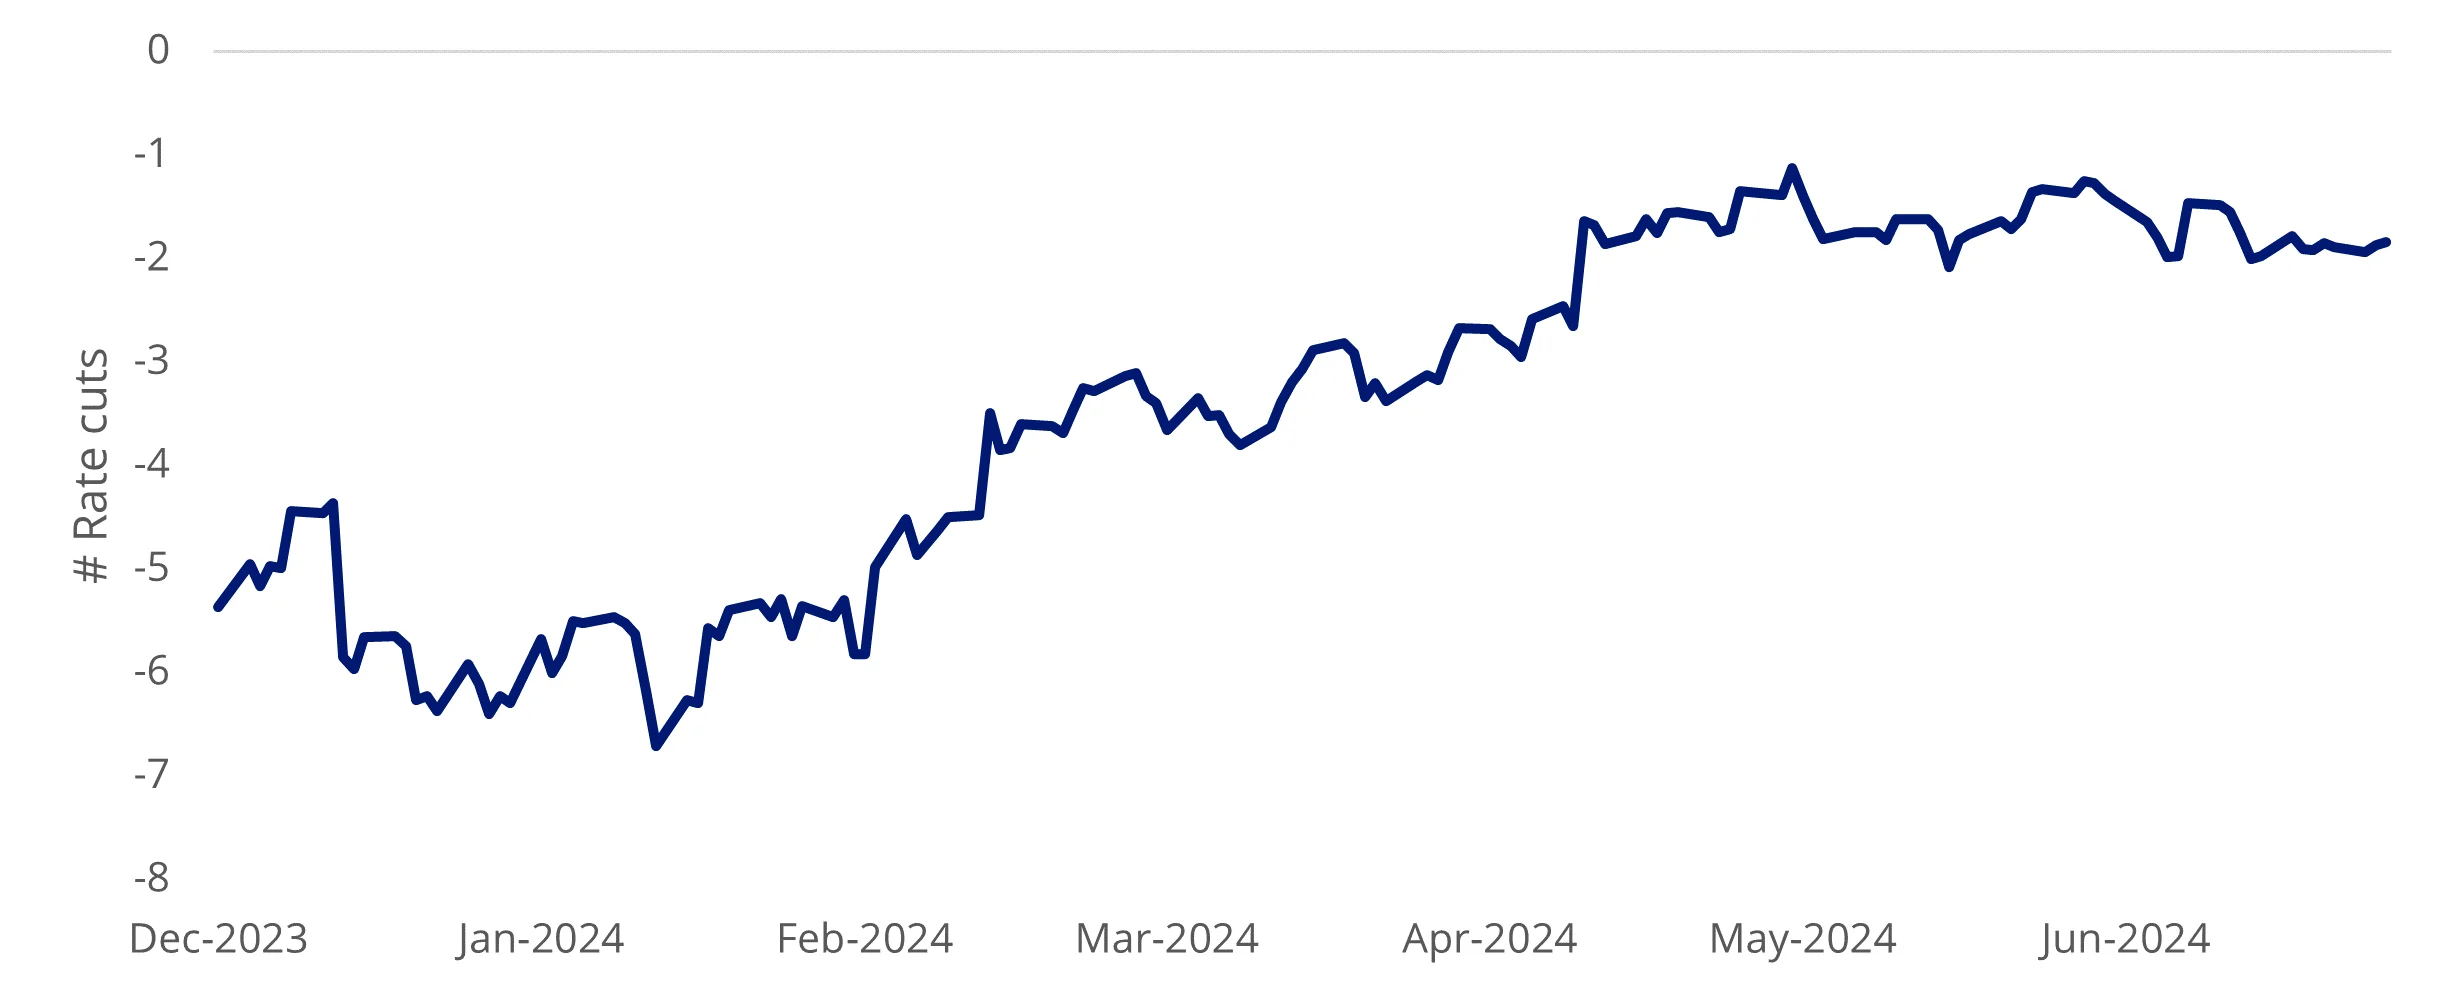
Source: Bloomberg, AUD returns, Commodities as Bloomberg Commodity Spot Index, Energy equities as S&P Global Energy Index, Resource equities as S&P Global Natural Resources Index, Financial equities as MSCI World Financials Index, Value equities as MSCI World Enhanced Value, Small cap equities as MSCI World Small Cap Index, Benchmark* as MSCI World Index.
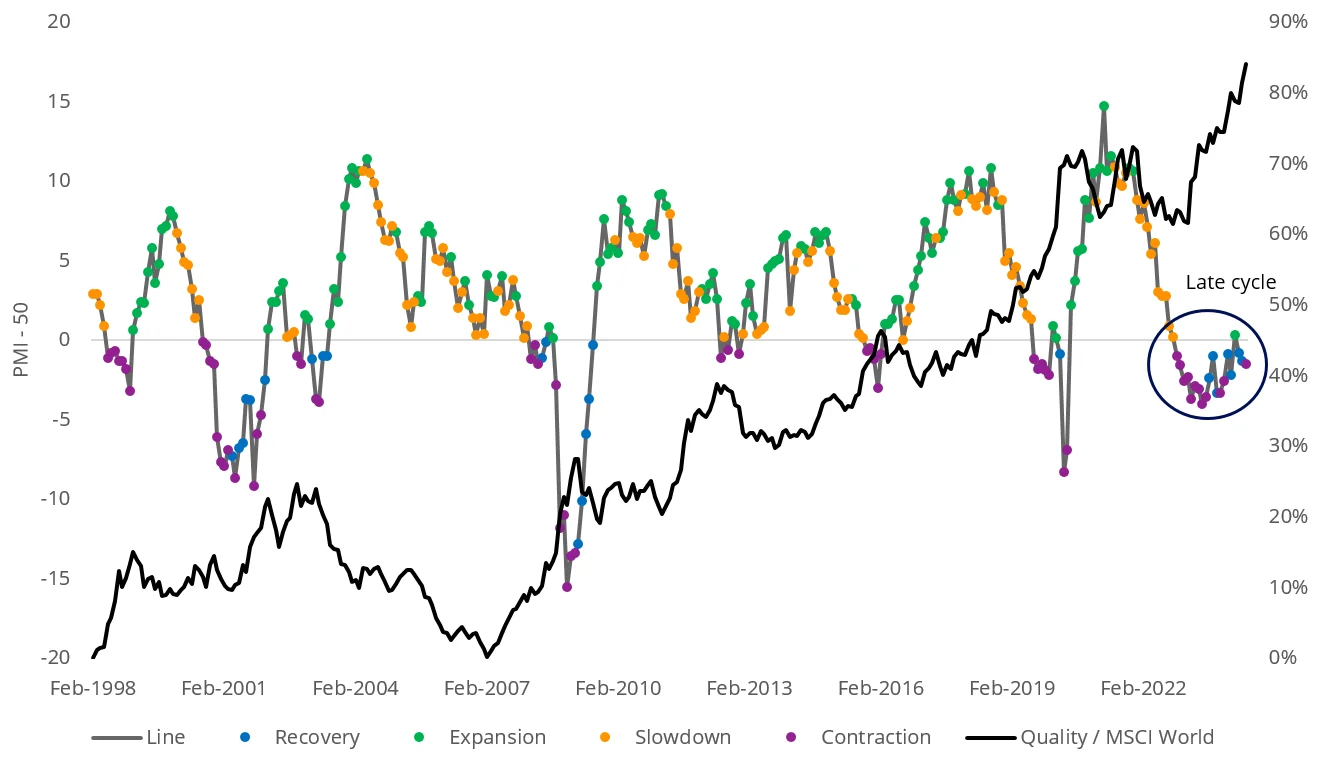
The global economy is currently in a ‘late cycle’ phase, characterised by positive but decelerating economic activity. The market is closely monitoring any indications of a shift toward an ‘early’ cyclical environment, where economic activity reaccelerates. This shift could prompt a portfolio rotation, considering that ‘cyclical asset classes’ historically perform best during early cycles while ‘defensive asset classes’ excel during late cycles. We saw signs of this between March and June this year. One key indicator for tracking the phase of economic activity is the US ISM Manufacturing PMI.
The PMI measures the change in production levels across the US economy from month-to-month. The chart below shows the three-month rolling PMI changes since 1997, highlighting the stage of the economic cycle at that time. Although it has recently shown signs of improvement akin to hopes of early cycle, the last two months’ data indicate a downward trend, suggesting a prolonged late cycle phase.
Chart 3: ISM Manufacturing PMI
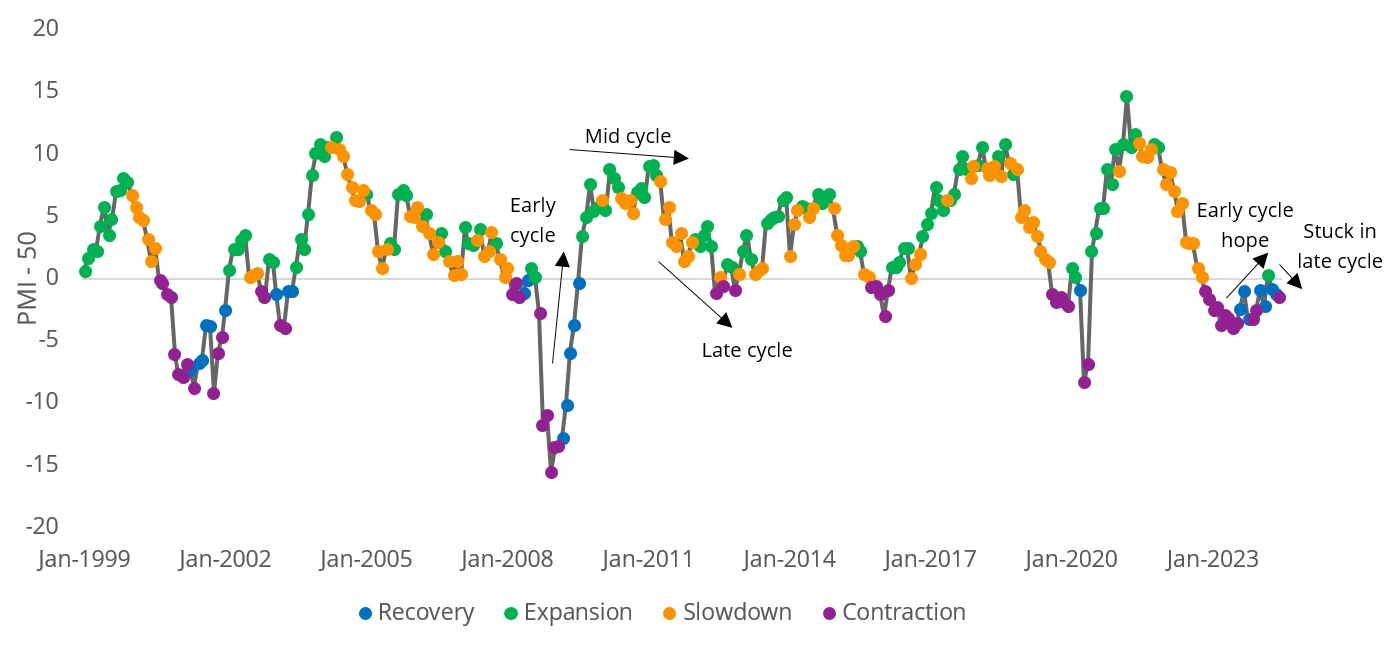
Source: ISM. As at 30 June 2024.
Although European and Canadian central banks have recently reduced rates in a bid to stimulate economic growth, the US is in on a different trajectory. Michelle Bowman, one of the Fed’s governors stated recently that she remained “willing to raise” borrowing costs again “should progress on inflation stall or even reverse”.
Chart 4: Inflation year on year
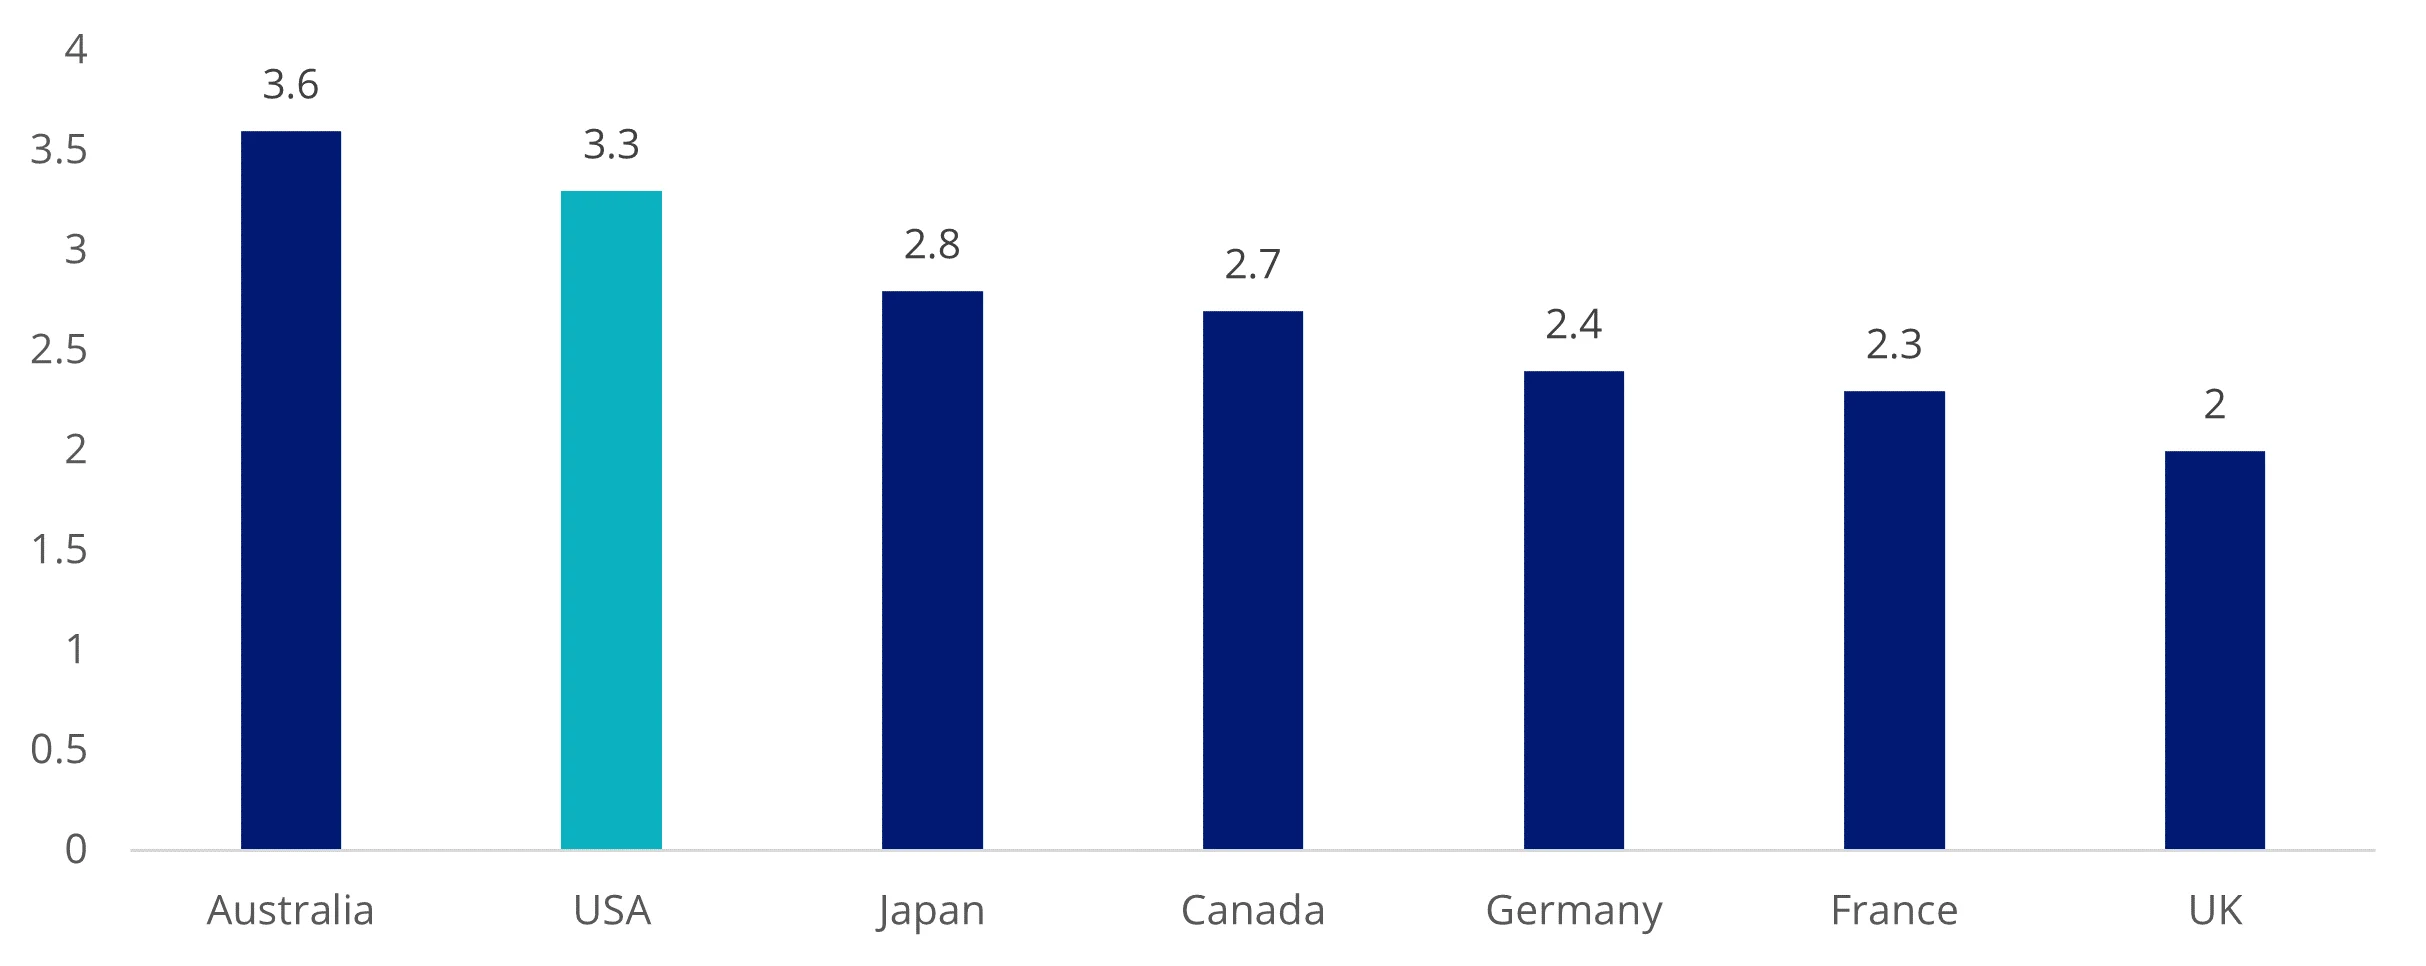
Source: Bloomberg, Data to 30 June 2024.
Chart 5: Central bank policy rate forecasts
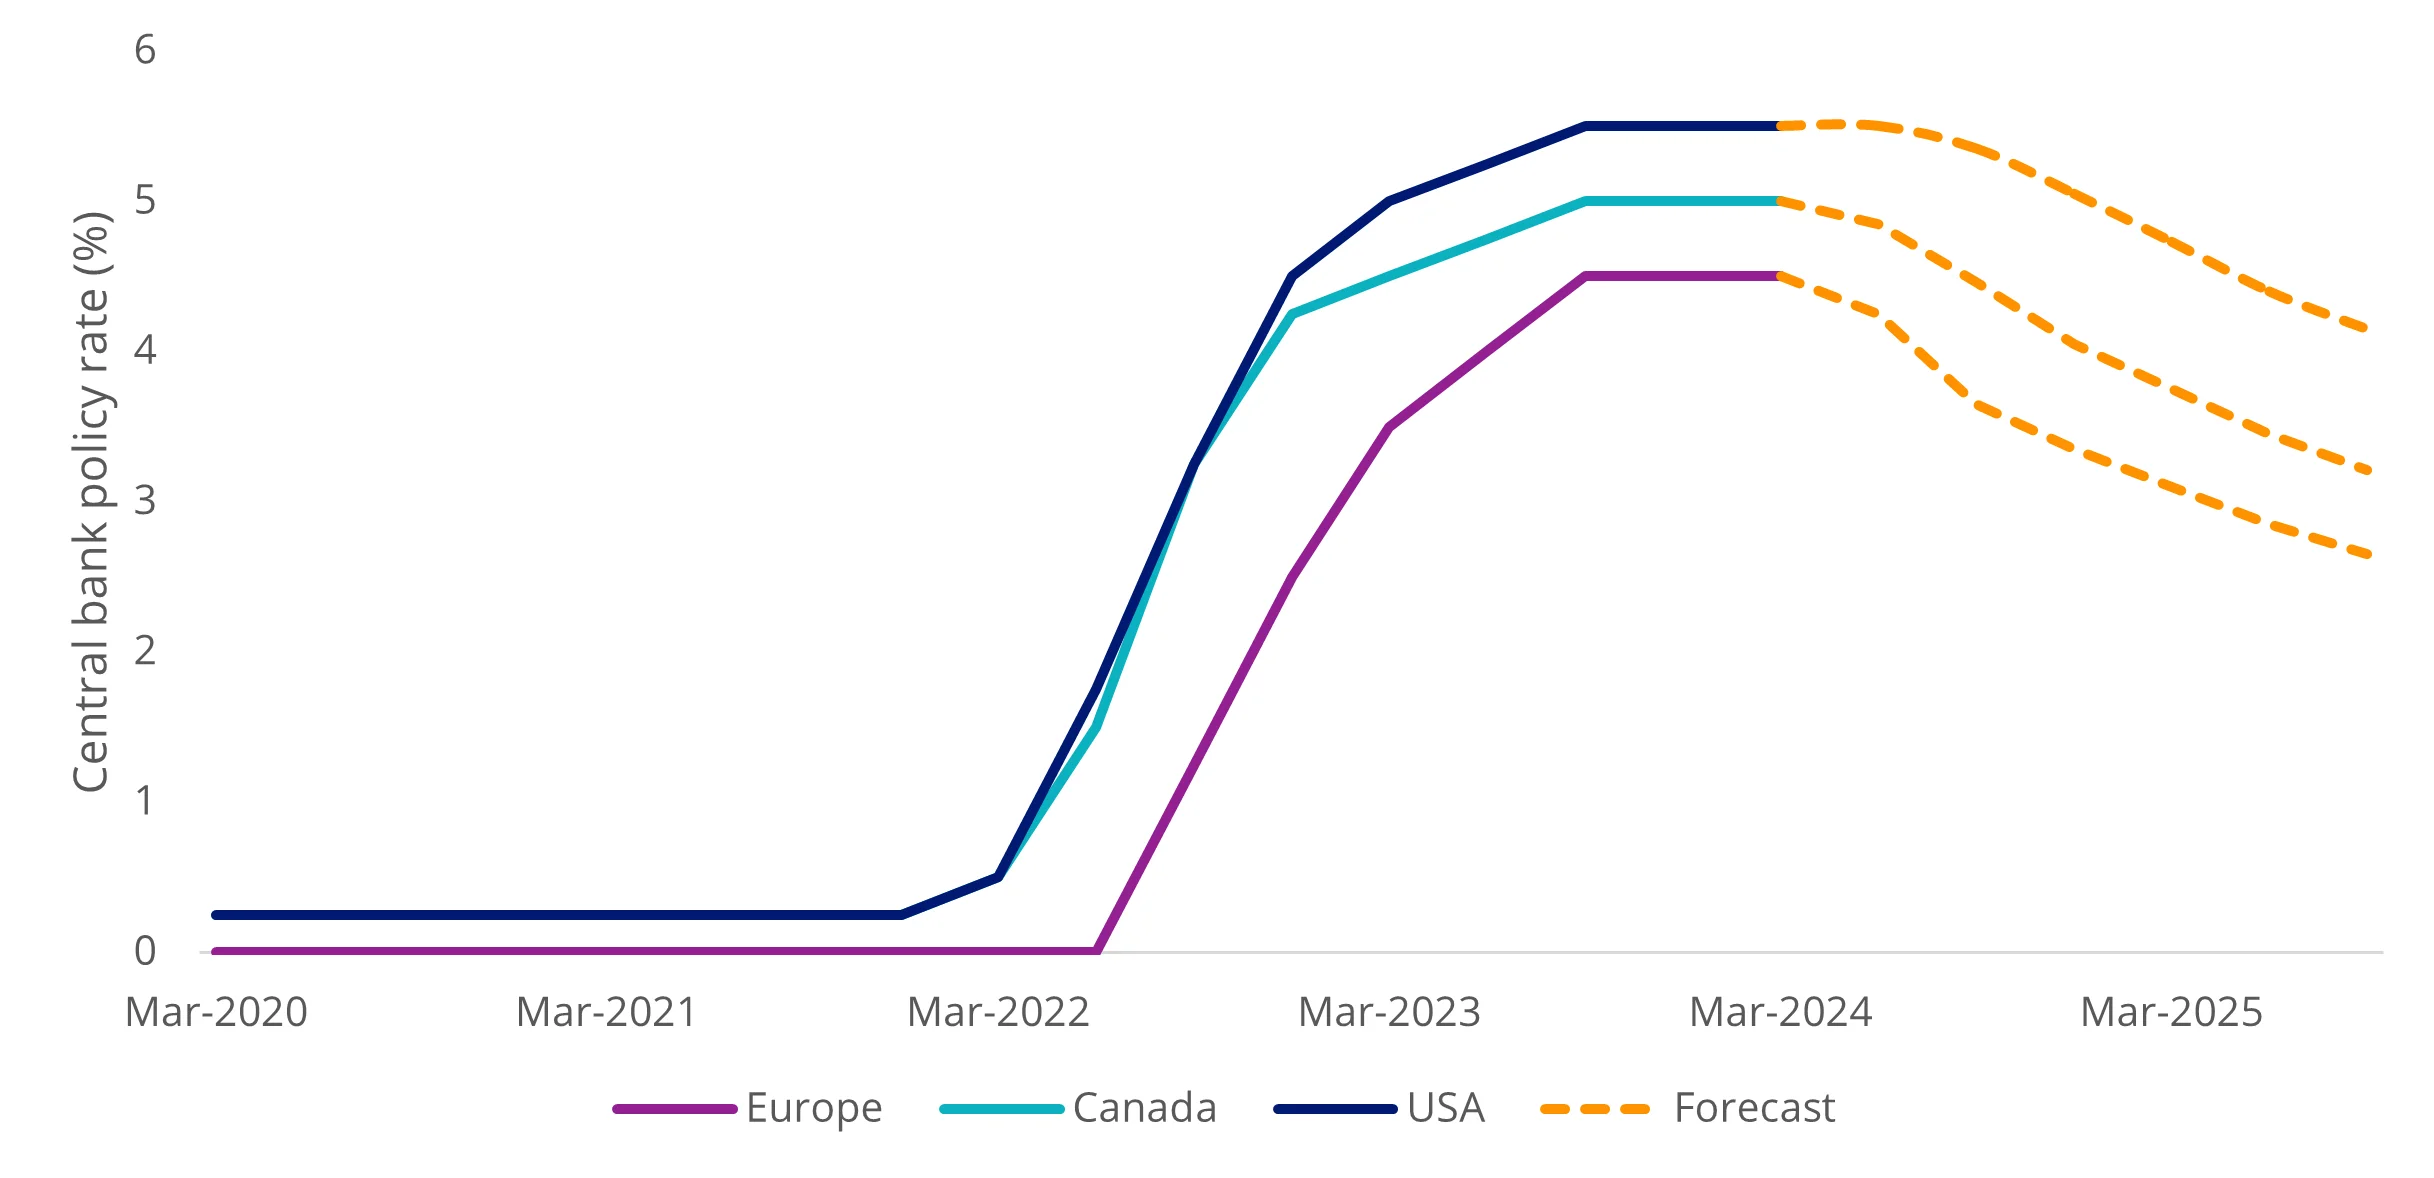
Source: Bloomberg, Data to 30 June 2024.
The US Federal Reserve faces a dilemma: while inflation is moderating, the rate of moderation has decelerated, largely due to persistent inflation in services components. Services inflation contribution year on year is 1.5 times higher than pre-COVID levels. Headline inflation year on year is 3.4%, significantly exceeding the Federal Reserve’s target of 2%.
Chart 6: US Inflation year on year by components - Services inflation persistent
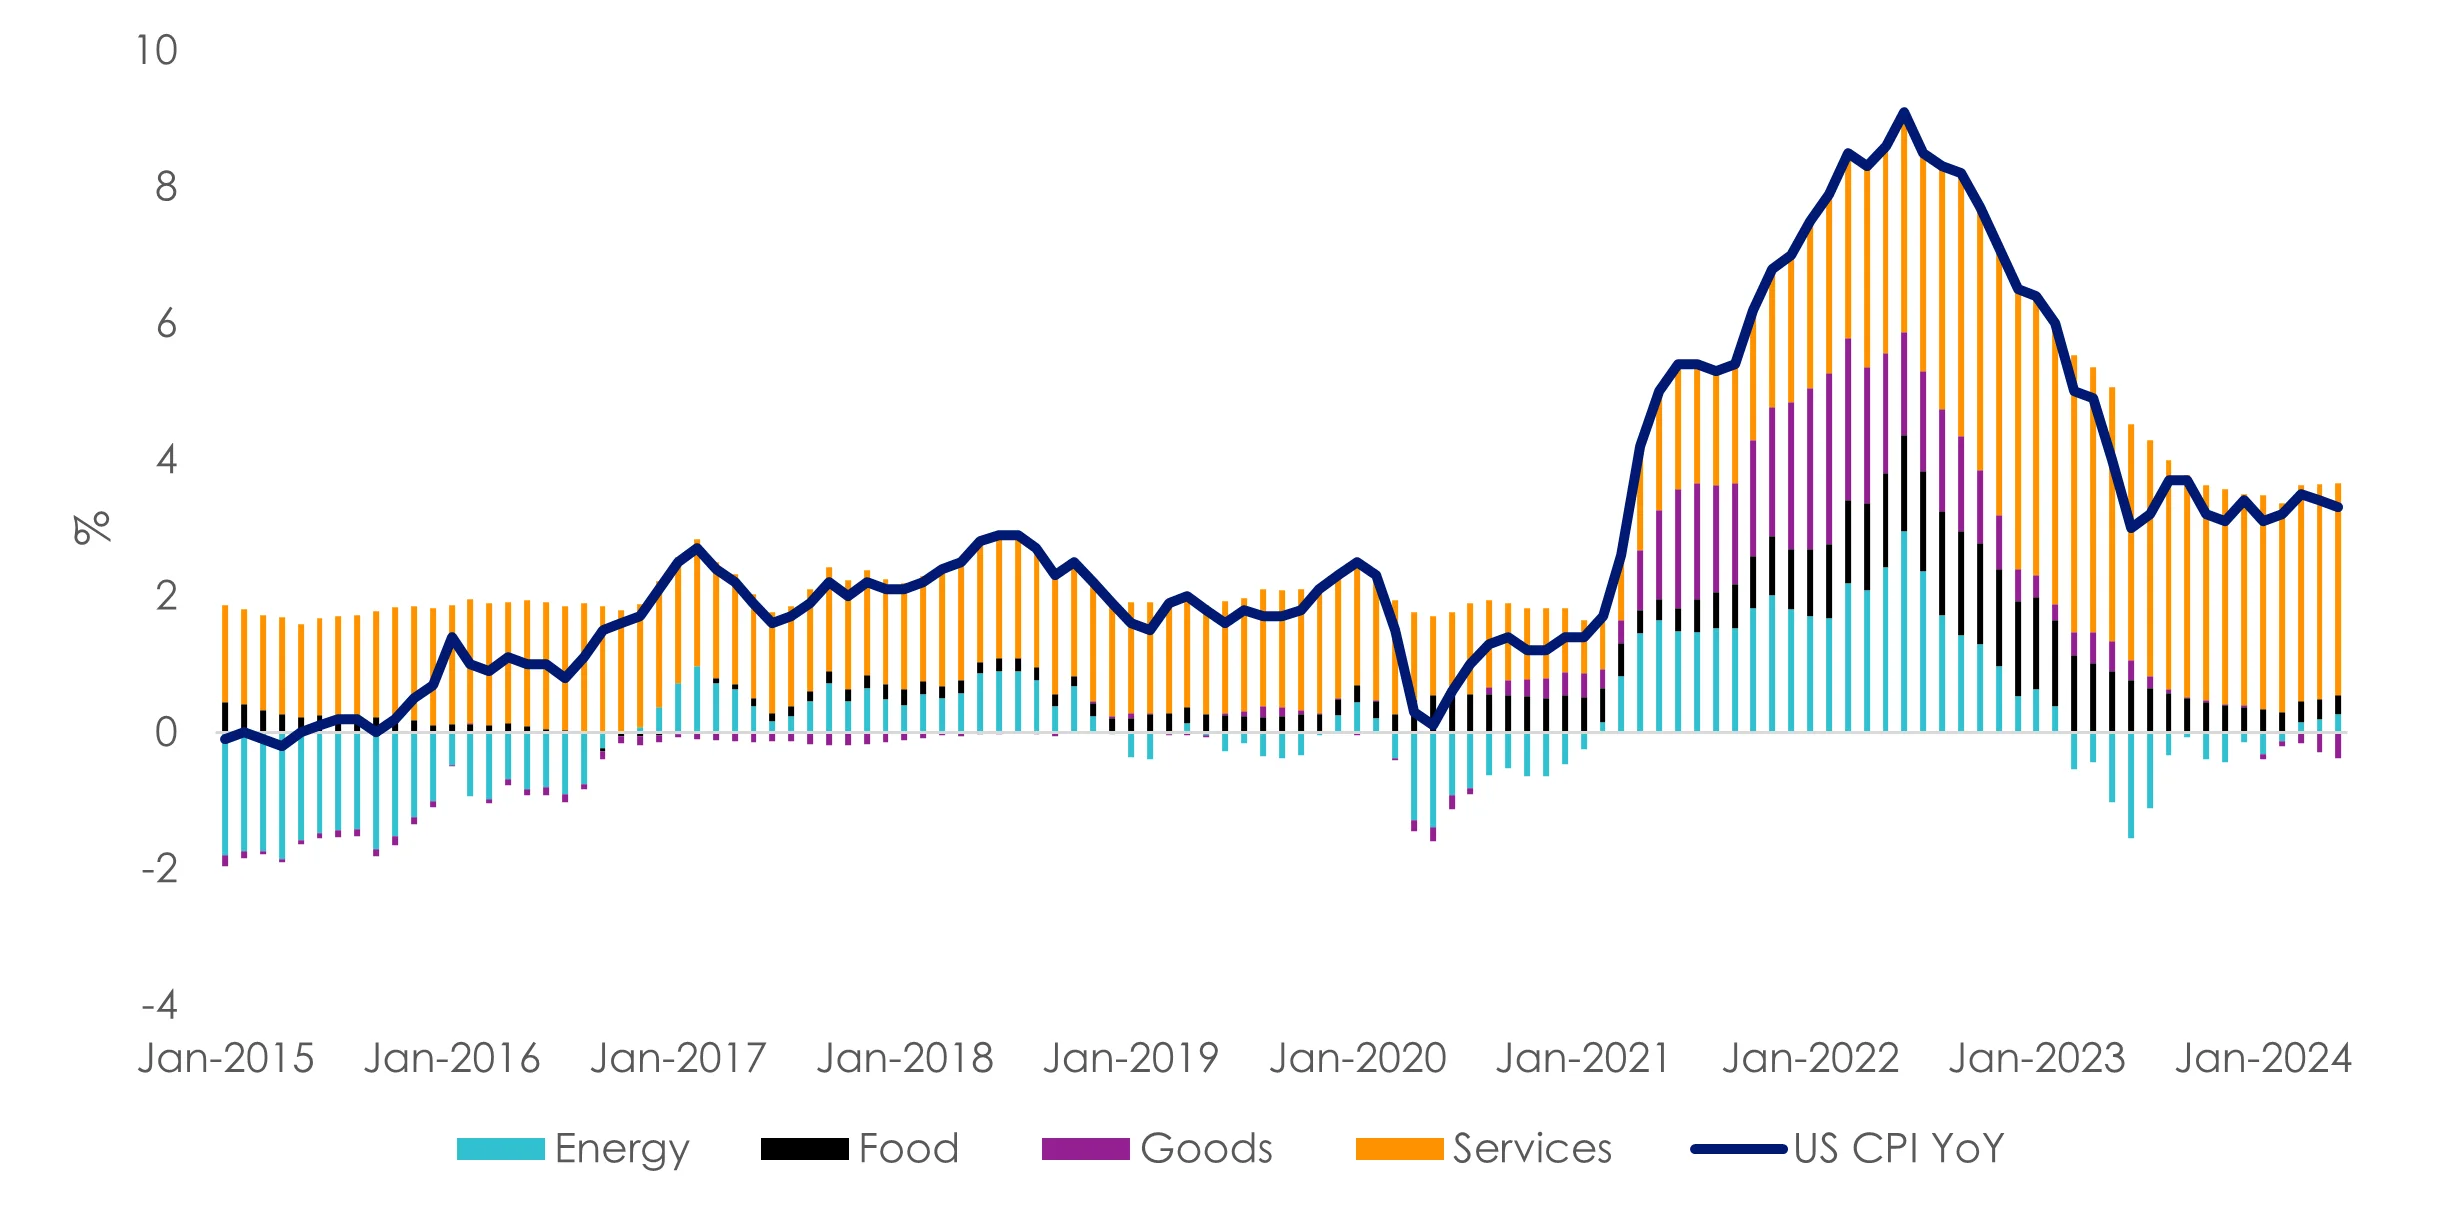
Source: Bureau of Labour Statistics, data to 31 May 2024.
Chart 7: Inflation year on year - Core and rent falling slowly
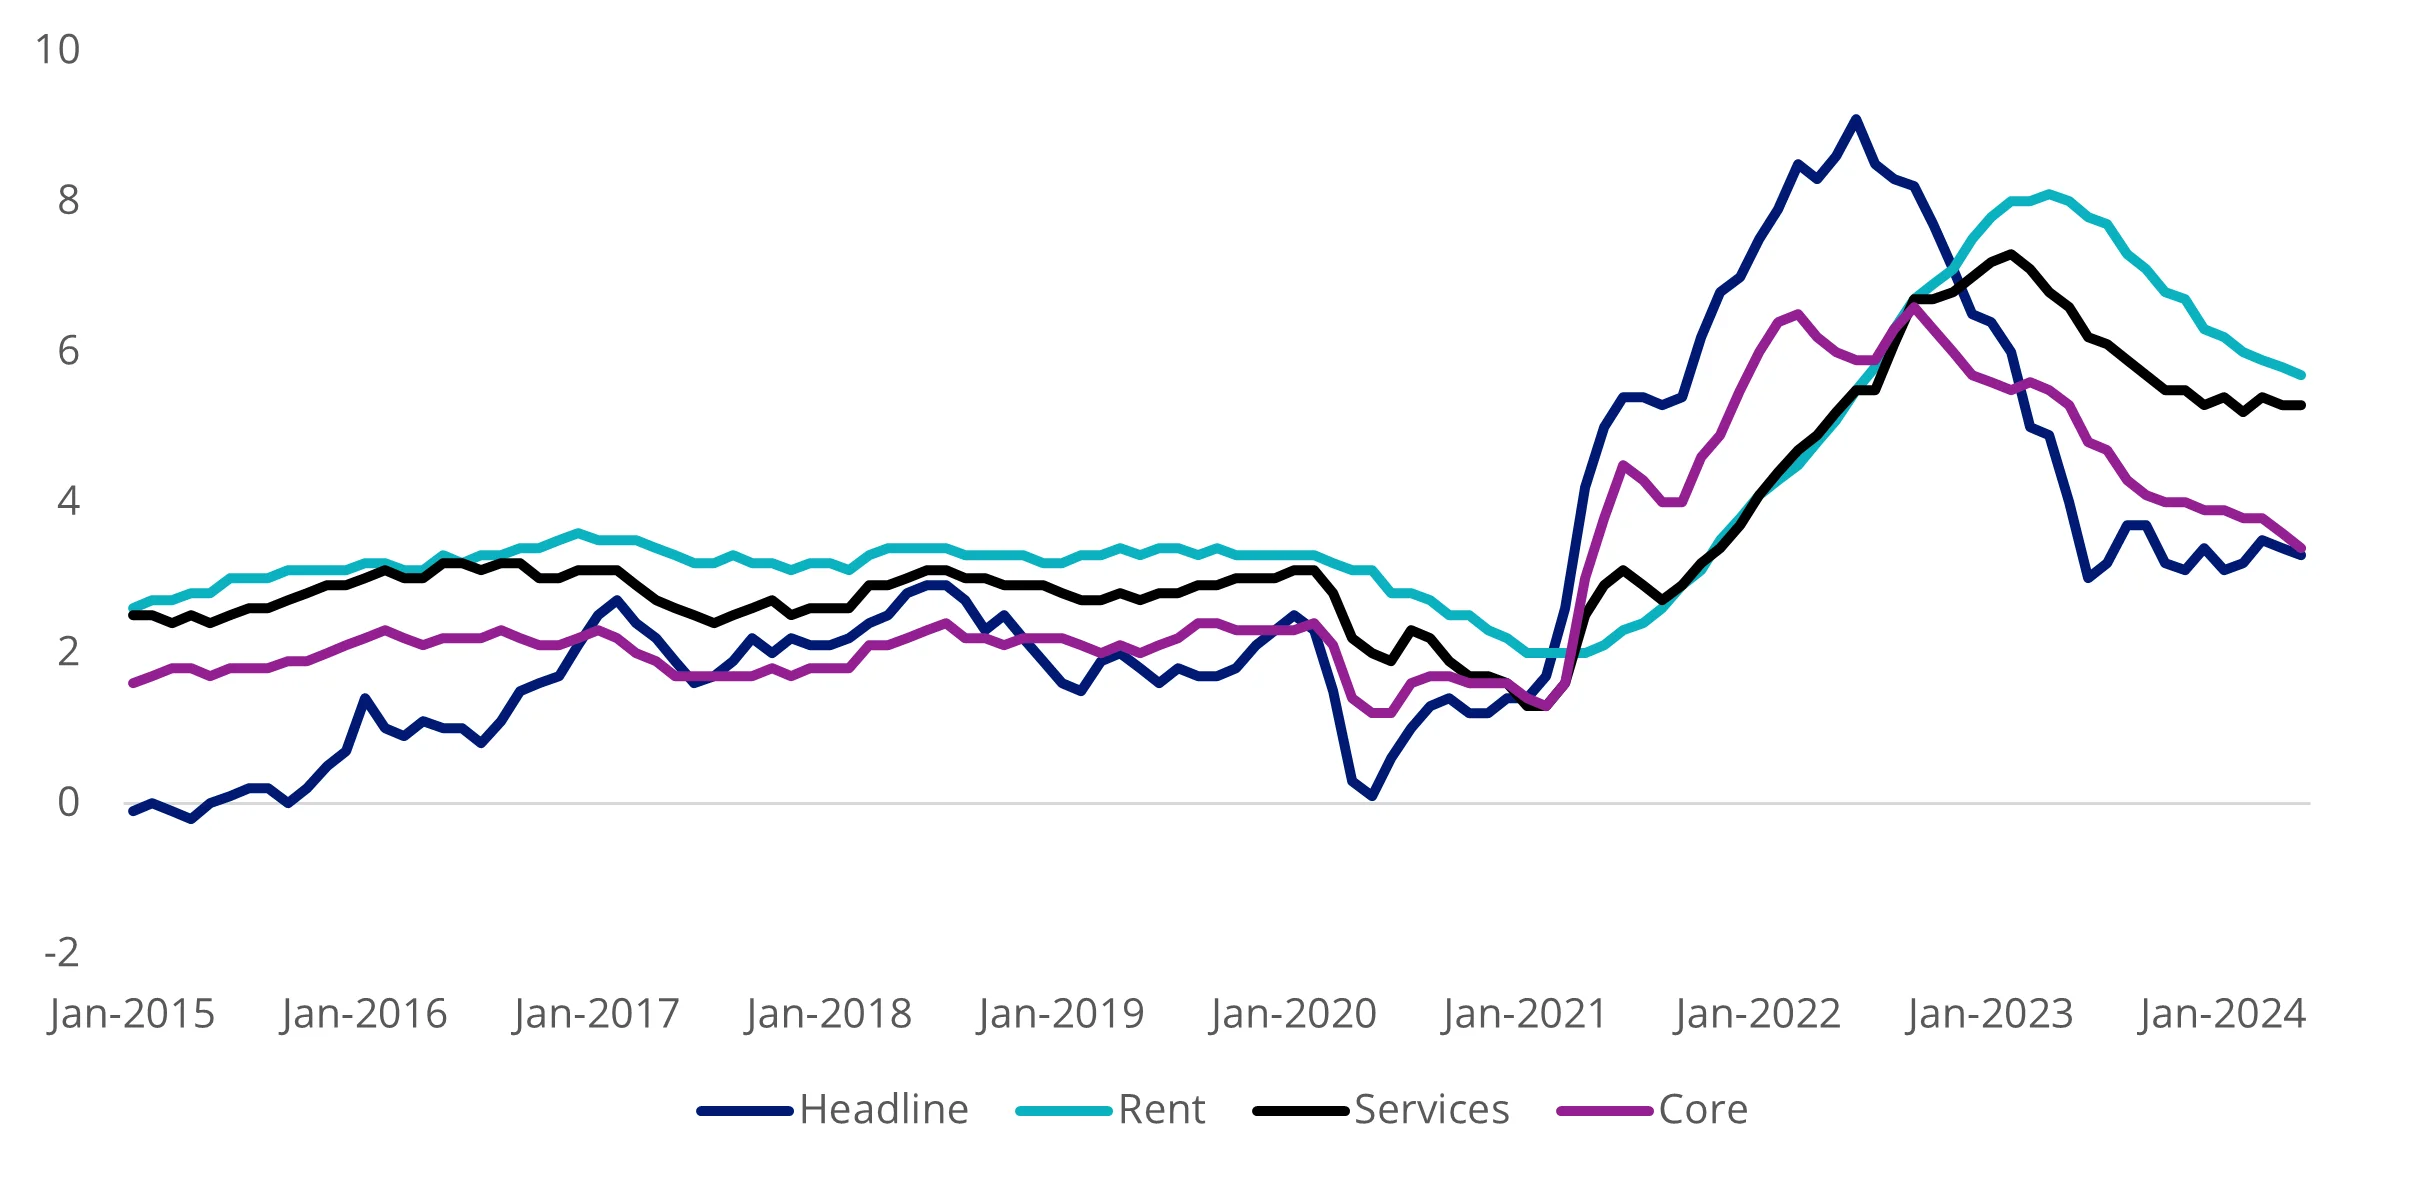
Source: Bureau of Labour Statistics, data to 31 May 2024.
A prolonged period of elevated rates implies that economic growth will likely continue to decline as the Fed seeks to mitigate demand-side inflationary pressures. In other words, remain in a late cycle environment. Investors might want to defensively position their portfolios, and one strategy is to invest in quality companies.
Quality companies according to world leading index providers are those with: high return on equity (ROE), stable year-on-year earnings growth and low financial leverage. They typically weather economic downturns better than their peers, making them more resilient during market volatility
Learn more about quality investing and the quality factor.
The chart below shows how quality companies have outperformed the MSCI World benchmark relative to the US ISM Manufacturing Index. This outperformance occurred during slowdowns, contractions, and recovery phases of the economic cycle.
Chart 8: Quality relative performance versus US Manufacturing activity
Source: ISM, Bloomberg, Quality as MSCI World Quality Index. Data to 30 June 2024.
Another important point is that equity market volatility, as measured by the VIX index, is currently at historical lows. However, if inflation remains persistent, economic growth proves bumpy or geopolitical tensions escalate, we might witness an increase in equity market volatility. Quality investments tend to perform well during such periods.
Chart 9: Quality relative performance versus equity market volatility
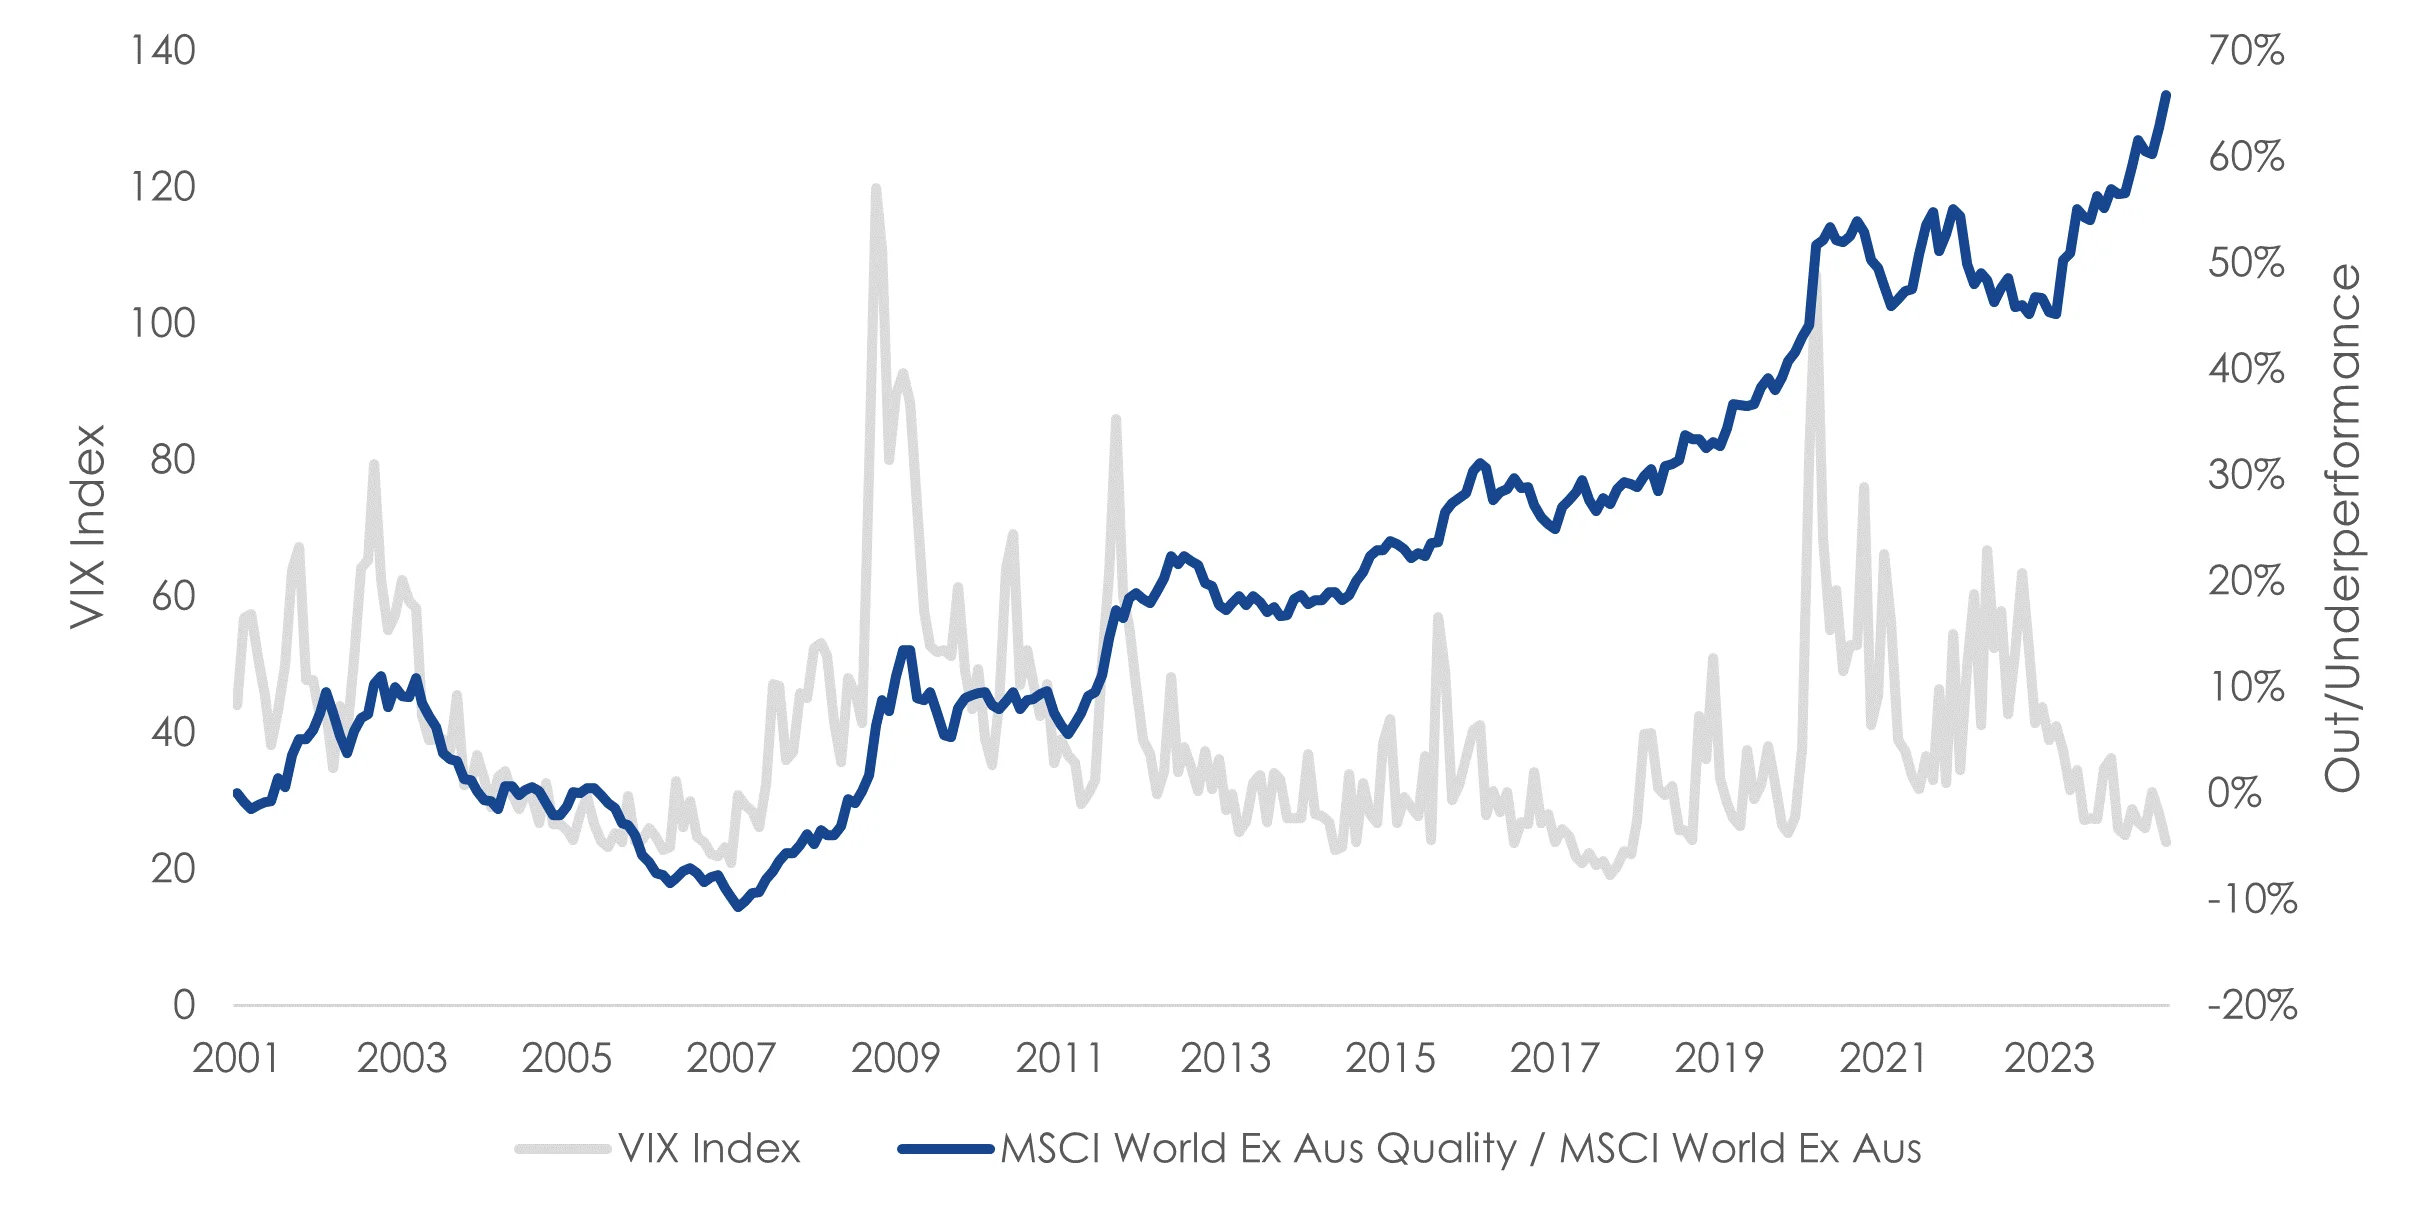
Source: Bloomberg. Data to 30 June 2024.
Investors can gain exposure to a portfolio of quality companies via ETFs which are listed on ASX. VanEck offers four quality ETFs:
- Our International Quality ETF (ASX: QUAL) invests in approximately 300 of the highest quality companies in the world, as measured by return on equity, low financial leverage and earnings stability.
- We also offer an AUD hedged version of QUAL, with ASX code: QHAL.
- Our International Small Companies Quality ETF (ASX: QSML) invests in approximately 150 of the highest quality small caps/companies in the world, as measured by return on equity, low financial leverage and earnings stability.
- And we also offer an AUD hedged version of QSML which has ASX code QHSM.
Key risks
An investment in the ETF carries risks associated with: ASX trading time differences, financial markets generally, individual company management, industry sectors, foreign currency, currency hedging, country or sector concentration, political, regulatory and tax risks, fund operations, liquidity and tracking an index. See the respective PDS and TMD for more details.


Published: 10 July 2024
Any views expressed are opinions of the author at the time of writing and is not a recommendation to act.
VanEck Investments Limited (ACN 146 596 116 AFSL 416755) (‘VanEck’) is the issuer and responsible entity of all VanEck exchange traded funds (Funds) trading on the ASX. This is not personal advice and does not take into account any person’s financial objectives, situation or needs. The product disclosure statement (PDS) and the target market determination (TMD) for all Funds are available at vaneck.com.au. You should consider whether or not any Fund is appropriate for you. Investments in a Fund involve risks associated with financial markets. These risks vary depending on a Fund’s investment objective.