Four ways to determine your international equities allocation
In the first decade of the new millennium emerging markets equities were stars, collectively outperforming their developed markets peers. According to Morgan Stanley, the second decade of the 2000s was “the worst decade for emerging stock market returns since records began in the 1930s.” As we approach the halfway point of the third decade, emerging markets are returning to investors’ radars.
These investors are drawn to attractive valuations (with record-high valuations elsewhere) and better-run economies. But the issue many investors ponder with emerging markets is how much to own. The answer is not simple and depends on the investor, but we will try to help.
How much emerging markets equities should you own for a long-term portfolio?
For many reasons, emerging market equities may experience enduring outperformance over developed market equities into the rest of the decade. Some of these include:
- Many emerging markets economies are growing at a faster pace than developed markets, in turn potentially offering higher equity returns, albeit at higher volatility.
- Export orientated emerging markets economies are strong beneficiaries of rising commodity prices.
- As many emerging market economies did not have the resources to spend their way out of the pandemic, many pressed ahead with economic reforms and didn’t accrue massive debts, which could accelerate economic growth in coming years.
- The acceleration of the digital revolution, which is unfolding faster in emerging markets than in developed countries.
You can see in chart 1, since 2001, emerging market equities have outperformed their developed markets international peers.
Chart 1: Developed versus Emerging Markets cumulative performance
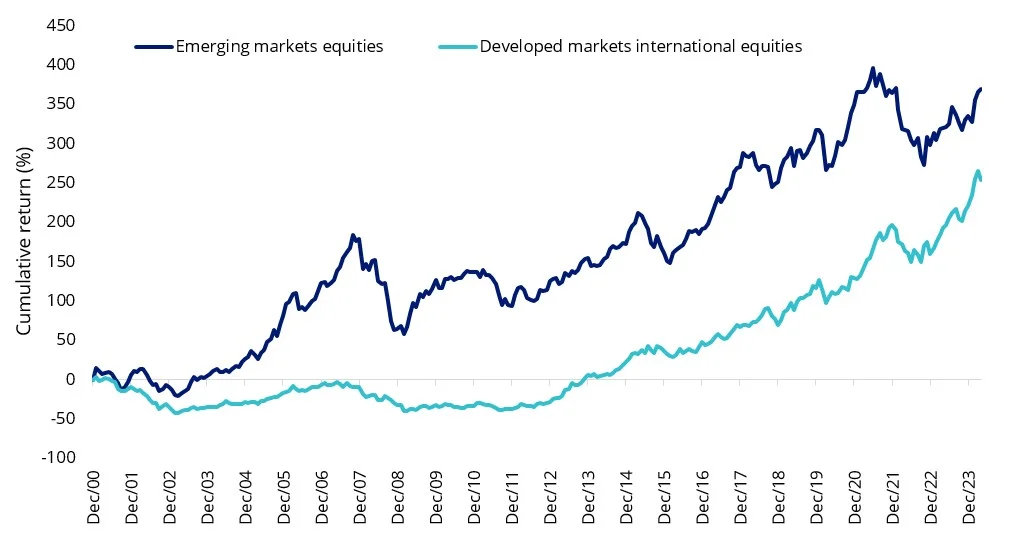
Source: Morningstar Direct, 31 December 2000 to 30 April 2024. Developed markets international equities is MSCI World ex Australia Index, Emerging markets equities is MSCI Emerging Markets Index. All returns are in Australian dollars. You cannot invest in an index. Past performance is not a reliable indicator of future performance.
Investors allocate to emerging markets for growth. They are a long-term investment, but how much of an investor’s international equity allocation should it be? It will depend on the risk tolerance of the investor, as emerging markets (EM) are considered riskier than developed markets (DM). You can see this risk in chart 1 with EM’s rises and falls being of a greater magnitude than those experienced in DM.
So, let’s consider a few popular approaches some investors have taken when considering their long-term EM allocation within international equities. But before we begin, it is useful to understand what EM equities are not.
The EM equity universe tends to be under-researched so there are opportunities to exploit inefficiencies. For this reason, sometimes comparisons are made with the small companies universe, which also tends to be under-researched. Investors allocate to small companies for growth too.
Under-research and growth are about where the similarities between small companies and EM equities end. Some of the largest companies in the world are in EM. To give you an idea of the companies in the emerging market equity universe, the average size of the ~1,400 companies in the MSCI Emerging Markets Index is A$169,163m. In the S&P/ASX Small Ordinaries, the average size of those 200 companies is A$2,630m. Considering EM equities like small caps is fraught with danger.
We, therefore, think an allocation to EM needs to sit beside all-cap DM international equity strategies as part of a diversified international equity portfolio.1
So, how much of this international equity portfolio should be allocated to EM?
-
Allocate to EM by market share
A basic approach for international equities, including EM, would be to consider the size (market capitalisation) of all the markets and proportionally allocate. There are different ways to do this, in the example below we have taken an index approach.
Market capitalisation indices include companies based on their size and each constituent of the index is weighted relative to its total market capitalisation. The larger companies represent a larger proportion of the index, likewise, those countries with bigger and more companies make up larger parts of international equity indices.
The most used EM equities index is the MSCI Emerging Markets Index (for ease of reading we’ll call it MSCI EM) which includes stocks from 24 countries MSCI consider ‘emerging’. The most used DM international equities index is the MSCI World ex Australia Index which includes companies from 22 countries MSCI considers ‘developed’.
The MSCI All Country World ex Australia Index (MSCI ACWI ex Aus) includes all 46 international developed and emerging markets.
As at the end of April 2024, MSCI ACWI had a 10% allocation to emerging markets.
This would imply a 10% allocation of the total international equity portfolio to EM. But when you consider that EM represented roughly 5% of the index in the year 2000, its market share has increased because of its higher growth, at the expense of DM. For more risk-tolerant investors, a higher allocation to EM would be needed to take advantage of that long-term growth.
-
Allocate to EM by GDP weight
One of the lures of EM investing is the faster economic growth within those countries. This growth can often flow through the share markets.
Economic output is measured by GDP (Gross Domestic Product) and you can see in the chart below, the percentage of global GDP generated by those countries with the MSCI EM index has been growing. At the beginning of this year, it was close to 47% of global GDP. That would suggest an allocation of 47% to EM equities, which from a risk perspective is far too high.
Chart 2: Contribution to total global GDP of MSCI EM countries
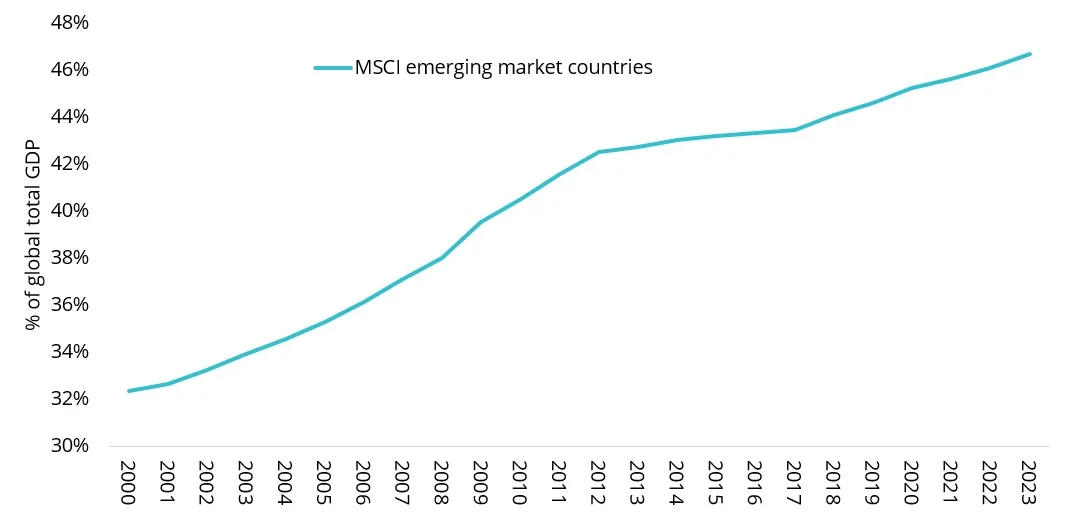
Source: IMF, VanEck, MSCI. Gross domestic product, current prices, purchasing power parity; international dollars.
-
Combining GDP and market share approach
Some investors use a combination of the above two approaches. A simple average of the two implies a 28% allocation. Some investors will adjust further for DM revenue that is derived from EM (for example Apple derives much of its revenue from emerging markets), bringing the allocation to EM down further still.
According to Morningstar Data, 25% of the revenue from the MSCI World ex Australia Index is derived from EM (as at 30 April 2024). This could imply that the allocation to EM equities should be reduced by 25%, so be 21%.
-
Using The Efficient Frontier
Another approach investors may take to construct long-term portfolios is by using The Efficient Frontier. The Efficient Frontier is derived from the Modern Portfolio Theory (MPT), and it suggests the most ‘efficient’ investment portfolios to generate returns for a set level of risk. The risk measure used is the standard deviation of returns. Using the past 20 years of returns and the standard deviation of those returns, we can plot the efficient frontier for a global equity portfolio allocating between developed markets and emerging markets.
Chart 3: Efficient Frontier
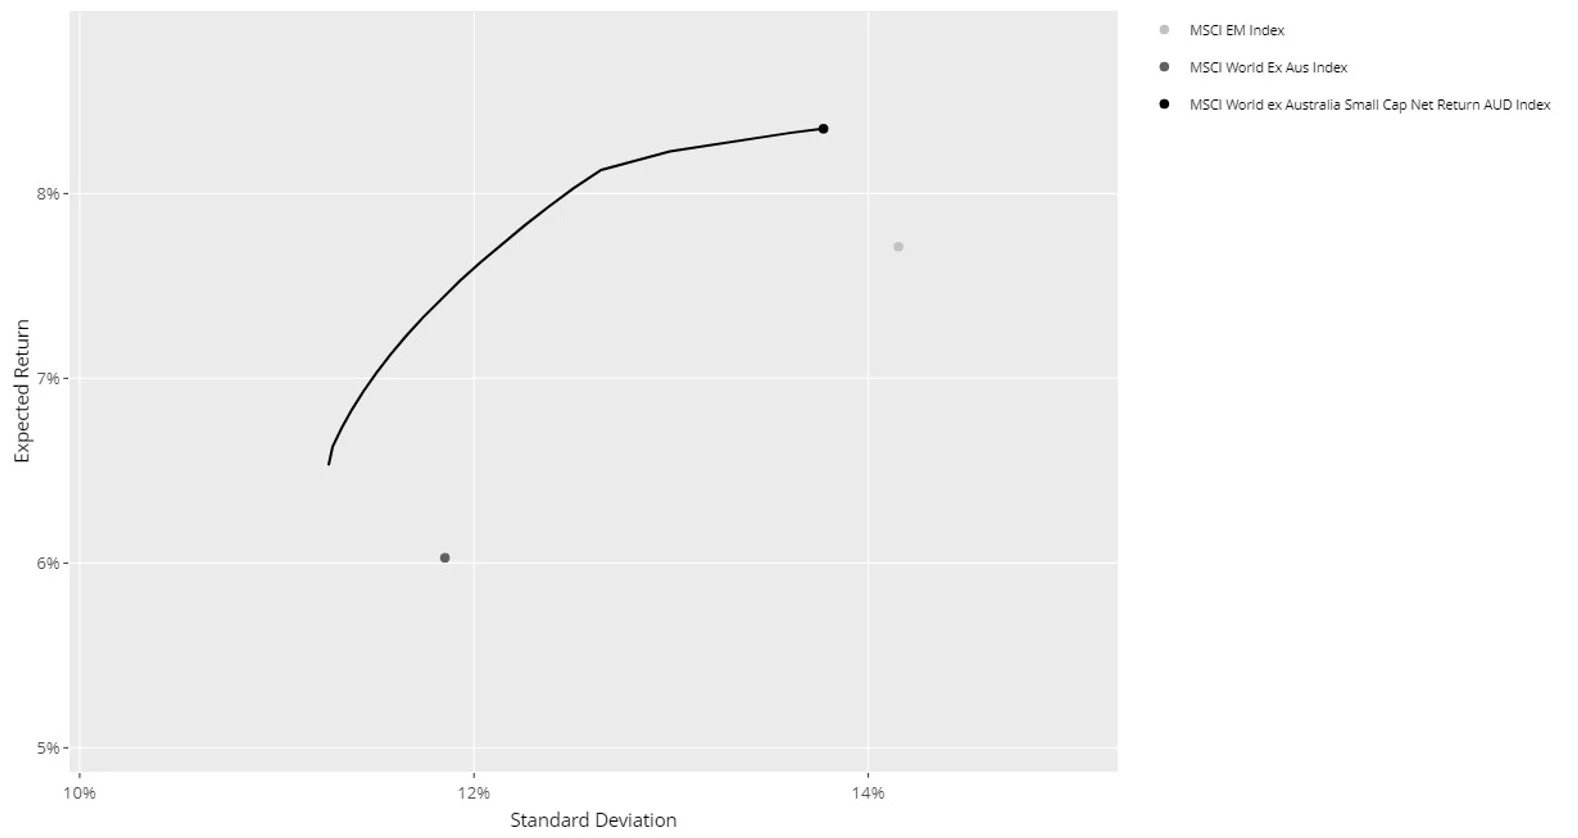
Source: VanEck, Bloomberg, MSCI, 31 December 2000 to 30 April 2024. All returns are in Australian dollars. You cannot invest in an index. Past performance is not a reliable indicator of future performance.
The efficient frontier allows you to extrapolate the implied allocation between the asset classes considered depending on the level of risk. The results show that EM has outperformed DM large and mid caps but underperformed DM small caps.
The math shows that for a standard deviation of returns between 11% and 13%, which would be considered high growth, an optimal allocation to EM would be as high as 37.68%.
Table 1: Efficient Frontier implied allocation between developed markets and emerging markets
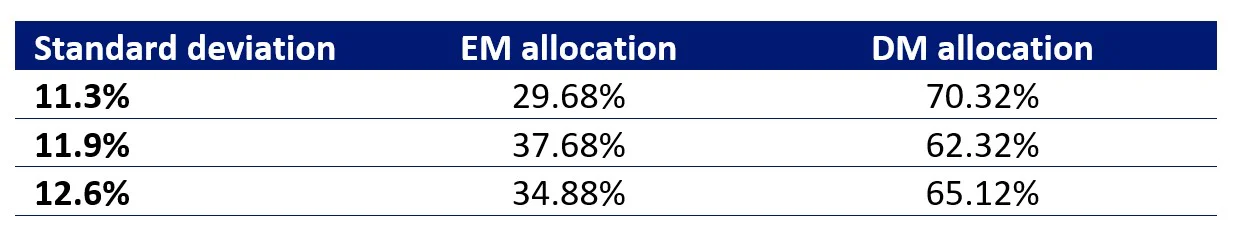
Source: VanEck, Bloomberg, MSCI, 31 December 2000 to 30 April 2024. EM allocation is MSCI EM Index. DM allocation is MSCI World ex Australia Index and MSCI World ex Australia Small Cap Index. You cannot invest in an index. Past performance is not a reliable indicator of future performance. Not a recommendation to act.
The efficient frontier suggests an allocation higher than the market share and the combined GDP and market share approaches. An allocation this high would be a high-growth strategy for a client with a high level of risk tolerance.
Risk-averse investors may be more comfortable with a smaller allocation closer to the market share approach or avoid the asset class altogether.
Investors willing to take on risk may find an emerging market allocation that sits somewhere between the extremes we’ve presented here, either way, we think EM equities warrant its own allocation as part of a well-diversified global equities approach.
Chart 4: Implied allocation to EM based on the approaches outlined above
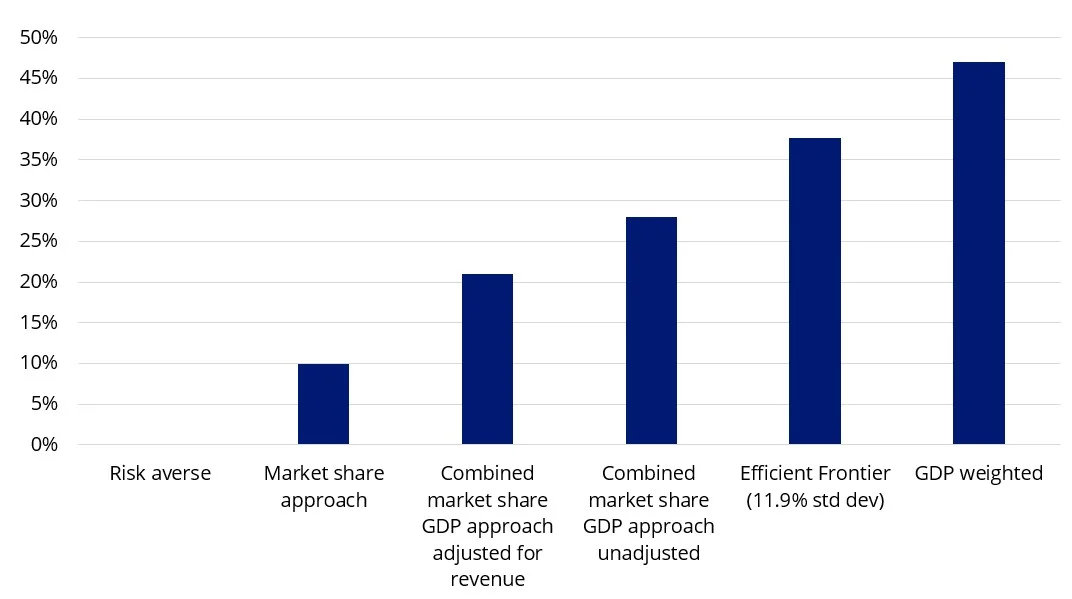
Source: VanEck. Not a recommendation to act.
We would warn however that taking the right approach is important.
As always, we would recommend you speak to a financial adviser or broker to determine which international equity allocation is right for you.
1Earlier this year our CEO Arian Neiron wrote an opinion piece in the AFR which included commentary about Australian investors’ DM international small companies allocation. In summary, Australians tend to be under-allocated to international small companies compared to Australian small companies and an international small companies allocation may be good diversification.
Key risks
An investment in emerging market funds carries risks associated with: financial markets generally, individual company management, industry sectors, ASX trading time differences, foreign currency, sector concentration, political, regulatory and tax risks, fund operations, liquidity and tracking an index.


Published: 02 June 2024