Navigating the four economic seasons with factors
Understand the four stages of the economic cycle and the long-term performance of two key factors—quality and value.
The weather has cooled, and in some parts of the world, so too has inflation.
Seasons are inevitable, change is constant and in markets, the economic cycle seemingly has one similarity to the seasons, there are four seasons as there are four stages of the economic cycle.
The four stages of the economic cycle however do not last for a set three months and the waves of the economic cycle vary in length and in magnitude and this makes it unpredictable.
The challenge for investors is finding the investment to suit the economic season or forecasted season, alternatively, even an investment that suits all seasons, if such an investment exists. An analysis of past cycles may help.
The economic cycle
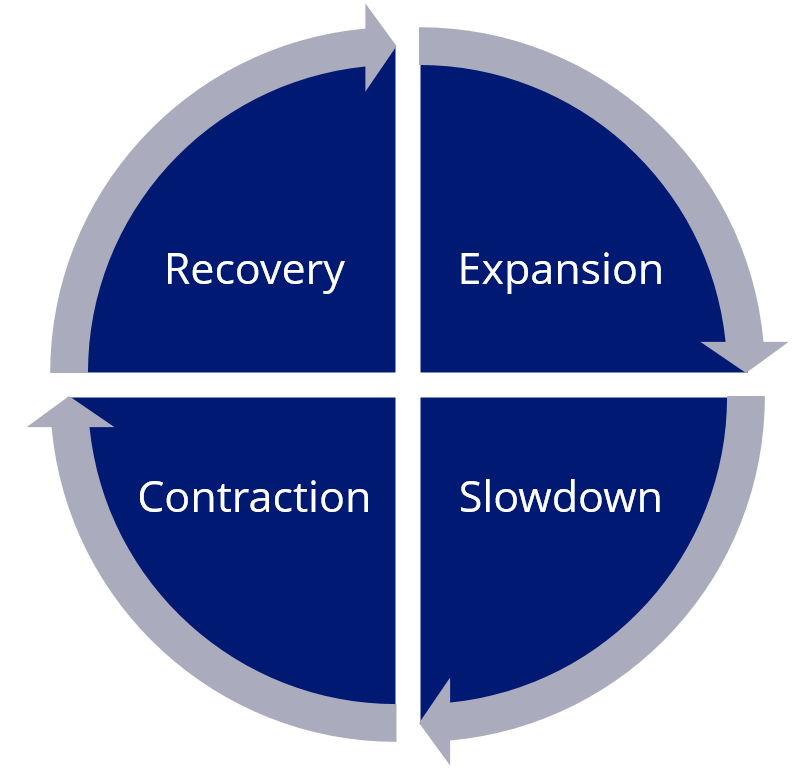
Four identifiable stages make up the economic cycle. They are expansion, slowdown, contraction and recovery.
Chart 1: The economic cycle
Source: VanEck
The direction and the pace of economic activity identify these cycles.
- An expansionary environment is when growth is expanding, and at a faster rate;
- A slowdown occurs when economic activity is slowing down after an expansion;
- A contraction occurs when economic growth is negative, and it is still falling; and
- A recovery is when, after the trough of a contraction, the economy starts to head toward growth.
The Purchasing Managers' Index (PMI) is an index used to measure the prevailing direction of economic trends in the manufacturing and service sectors. It measures the change in production levels across the economy from month-to-month, so it’s considered a key indicator of the state of the economy.
The chart below shows the three-month rolling PMI changes since 1997, highlighting the stage of the economic cycle at that time. You can see recently, since December 2022, the economy has been in a period of contraction (purple dots) and recovery (blue dots) with the notable exception of the March 2024 expansionary (green dot) reading.
Chart 2: ISM Manufacturing PMI Index

Source: VanEck, Bloomberg. November 1998 to May 2024.
Over the same period of the chart above, the global share market, as represented by the MSCI World Index, has risen despite the well-noted falls experienced in the dot.com bust, the GFC and the COVID crisis. If we also consider MSCI’s quality and enhanced value indices, you can see that over the longer term, these have outperformed the share market index’s rise.
Chart 3: Growth of 10,000: MSCI World ex Australia Index

Source: Bloomberg, as at 31 May 2024. Indices used are MSCI World Index, MSCI World Quality Index and MSCI World Enhanced Value Index. Past performance is not a reliable indicator of future performance. You cannot invest in an index. Results are calculated to the last business day of the month and assume immediate reinvestment of all dividends and exclude fees and costs associated with investing
If you consider charts 2 and 3 together, what is evident is that value and quality perform differently during different economic regimes. We analysed the performance of MSCI’s equity style factors of enhanced value and quality since November 1997 to understand their performance during the four different economic stages of the cycle. The performance of each factor broken up by each economic ‘season’ is presented below.
Table 1: Total performance (% per annum) during economic cycles: November 1997 to May 2024

Source: VanEck, Bloomberg. Indices used are MSCI World Index (for benchmark), MSCI World Quality (for quality) Index and MSCI World Enhanced Value Index (for enhanced value). Past performance is not a reliable indicator of future performance. You cannot invest in an index. Results are calculated to the last business day of the month and assume immediate reinvestment of all dividends and exclude fees and costs associated with investing Past performance is not a reliable indicator of future performance.
You can see that over the past 26 plus years, the quality factor has experienced total positive performance in all the economic regimes over the past 25 years. Meanwhile, value, as represented by MSCI’s enhanced value, had positive performance over all of the economic cycles over 26 years, except during contractions. The total performance of both factors exceeds the benchmark index.
If you consider the above relative to the benchmark, you can see that quality’s relative underperformance during expansion is dwarfed by its strong relative outperformance during recoveries and contractions. Enhanced value, meanwhile, outperformed during strongest during recoveries, but unlike quality, experienced outperformance during the subsequent expansions.
Table 2: Performance differential (% per annum) compared to MSCI World during economic cycles: November 1997 to May 2024

Source: VanEck, Bloomberg. Indices used are MSCI World Index (for benchmark), MSCI World Quality (for quality) Index and MSCI World Enhanced Value Index (for enhanced value). Past performance is not a reliable indicator of future performance. You cannot invest in an index. Results are calculated to the last business day of the month and assume immediate reinvestment of all dividends and exclude fees and costs associated with investing Past performance is not a reliable indicator of future performance. The performance differential is calculated by subtracting the total return from the return of the benchmark.
You can see from the above, that the quality factor does have periods of underperformance, but its potential to outperform through the cycle, we think, means that it could potentially be used as the factor for all seasons. During those economic periods of recovery into expansion, the enhanced value factor could also be considered. Or perhaps a blend of the two.
It is challenging for investors to navigate economic conditions and prevailing markets. ETFs that capture the factors outlined above are being utilised by savvy investors, to either hold through the cycle, or blend, to help mitigate the troughs of the cycle.
Out of interest, since November 1997 using PMIs, recovery has been the least common economic regime, occurring only 8% of the time, while expansions have been the most common (39%). Over that same period, the global economy has been in a slowdown for 35% of the time, and 18% of the time it has experienced contraction.
Factor ETFs, helps investors navigate the seasons of the global economic cycle. VanEck is one of the largest ETF providers in the world, and in Australia, we are leaders in smart beta including factor ETFs. These include:
International equities
International small companies
Investors can learn more about what defines the quality factor here and how the value factor works here.
Key risks: An investment in the ETFs carries risks associated with: ASX trading time differences, financial markets generally, individual company management, industry sectors, foreign currency, country or sector concentration, political, regulatory and tax risks, fund operations and tracking an index. See the PDS for details.


Published: 24 June 2024
Any views expressed are opinions of the author at the time of writing and is not a recommendation to act.
Any views expressed are opinions of the author at the time of writing and is not a recommendation to act. VanEck Investments Limited (ACN 146 596 116 AFSL 416755) (VanEck) is the issuer and responsible entity of all VanEck exchange traded funds (Funds) trading on the ASX. This is general advice only and does not take into account any person’s financial objectives, situation or needs. The product disclosure statement (PDS) and the target market determination (TMD) for all Funds are available at vaneck.com.au. You should consider whether or not an investment in any Fund is appropriate for you. Investments in a Fund involve risks associated with financial markets. These risks vary depending on a Fund’s investment objective. Refer to the applicable PDS and TMD for more details on risks. Investment returns and capital are not guaranteed.