Australian investors miss out on mining deal upside
Markets are constantly changing, and investors should be mindful of the composition of markets and portfolios. For an Australian equity allocation, the S&P/ASX 200 benchmark has and continues to be the widely accepted beta – an index concentrated by stock and sector, a point we have harboured for many years. What it means for many Australian investors is that they do not have meaningful exposure to those companies that have greater potential for higher returns and those companies that are more likely to be takeover targets.
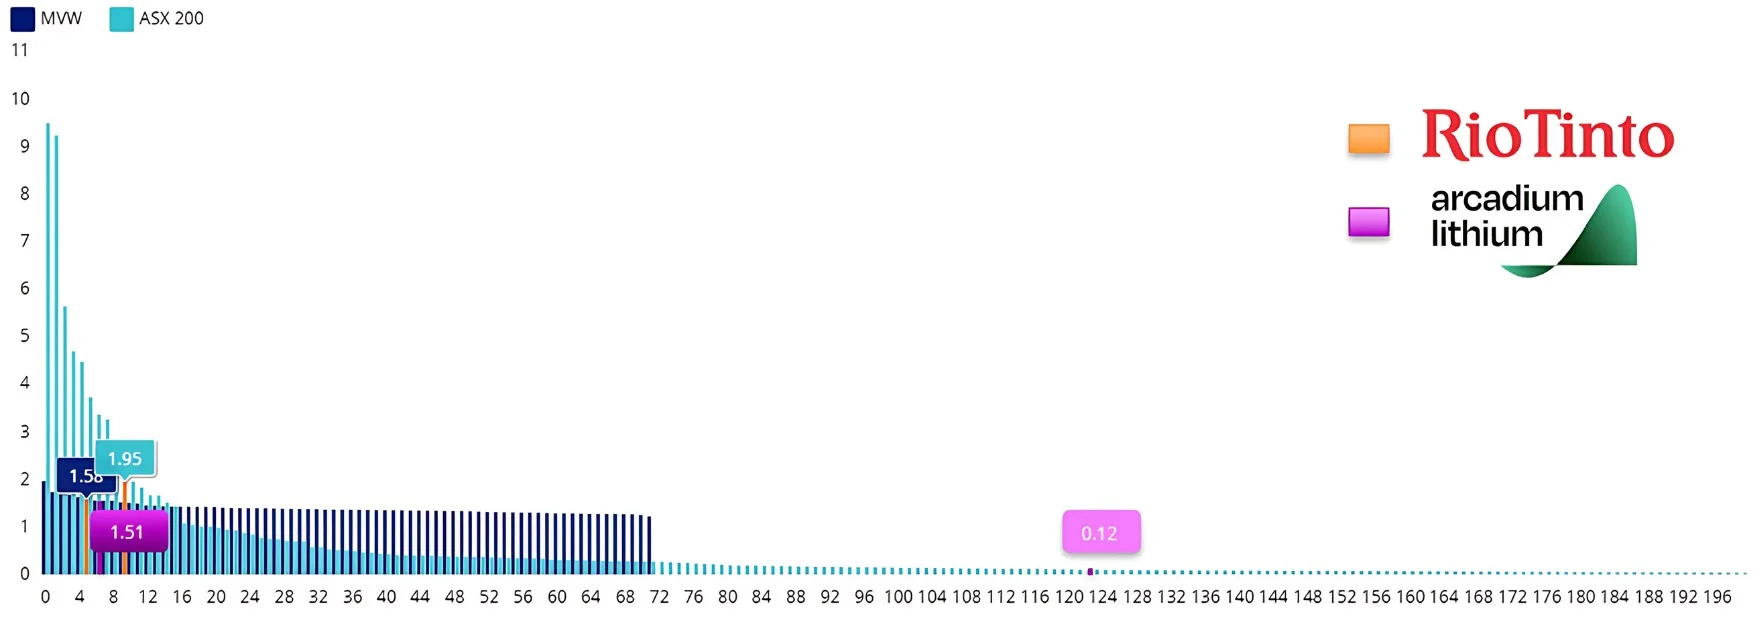
We have seen this play out recently when Rio Tinto announced its intention to take over miner Arcadium Lithium, resulting in the latter’s share price rising almost 40%. At the end of last month, Arcadium Lithium represented a meagre 0.12% of the S&P/ASX 200. At the same time, as one of the most liquid stocks on ASX, it was 1.51% of the VanEck Australian Equal Weight ETF (MVW). As a result, the impact of the takeover has had a bigger impact for MVW than it has for investors in funds that closely track the S&P/ASX 200, seeing it outperform the market benchmark – see Table 1 below for full performance history of MVW. MVW is unique because of its alternative portfolio construction approach.
Managing Australian equities with alternative weighting
Rather than constructing an index or a portfolio considering a constituents’ size, like the S&P/ASX 200 or S&P/ASX 300, the MVIS Australia Equal Weight Index (MVW Index) that MVW tracks includes only the largest and most liquid companies on ASX. MVW Index currently includes 72 companies, and it equally weights them once a quarter at each rebalance.
Australian equity market – stocks weights
The MVW Index’s equal weight construction methodology means that at last rebalance, no stock was more than 1.39%. The impact of this is that MVW is underweight the mega-caps that dominate the S&P/ASX 200. What this means is that if, say, BHP or CBA go down or up 2%, its impact on the S&P/ASX 200 is greater than in the MVW Index.
On the other side of the coin, there are 56 companies within the MVW Index that have a higher weighting compared to the S&P/ASX 200 and therefore they have greater influence on MVW’s returns. As Chart 1 below shows, MVW has a larger exposure for around 80% of its portfolio than the market capitalisation-weighted benchmark index. The companies in which MVW is overweight may be former small and mid-caps that have grown large, or they may be large or mega caps that have fallen in size. Importantly, these companies have much greater growth potential or are more likely to be taken over than the largest handful of stocks on ASX, as highlighted by the Rio/Arcadian transaction.
Chart 1: Constituent rank and weightings of MVW versus S&P/ASX 200

Source: Factset, 30 September 2024
It’s not just takeover targets that MVW may be overweight. It is also those companies with greater potential for growth.
Australian equity market – ergodicity
In 2018, we introduced many Australian investors to the term ‘ergodicity’ in our white paper: Why Equal Weighting Outperforms: The Mathematical Explanation. As a refresher, ergodicity refers to the property of each constituent having the same chance at any point of the distribution, as any other constituent. In this case, we were looking at the size of the company and its returns. If the distribution of returns among the companies on the ASX were ergodic, there would be no differentiation between the dispersion of returns between mega-caps and the smaller-sized companies.
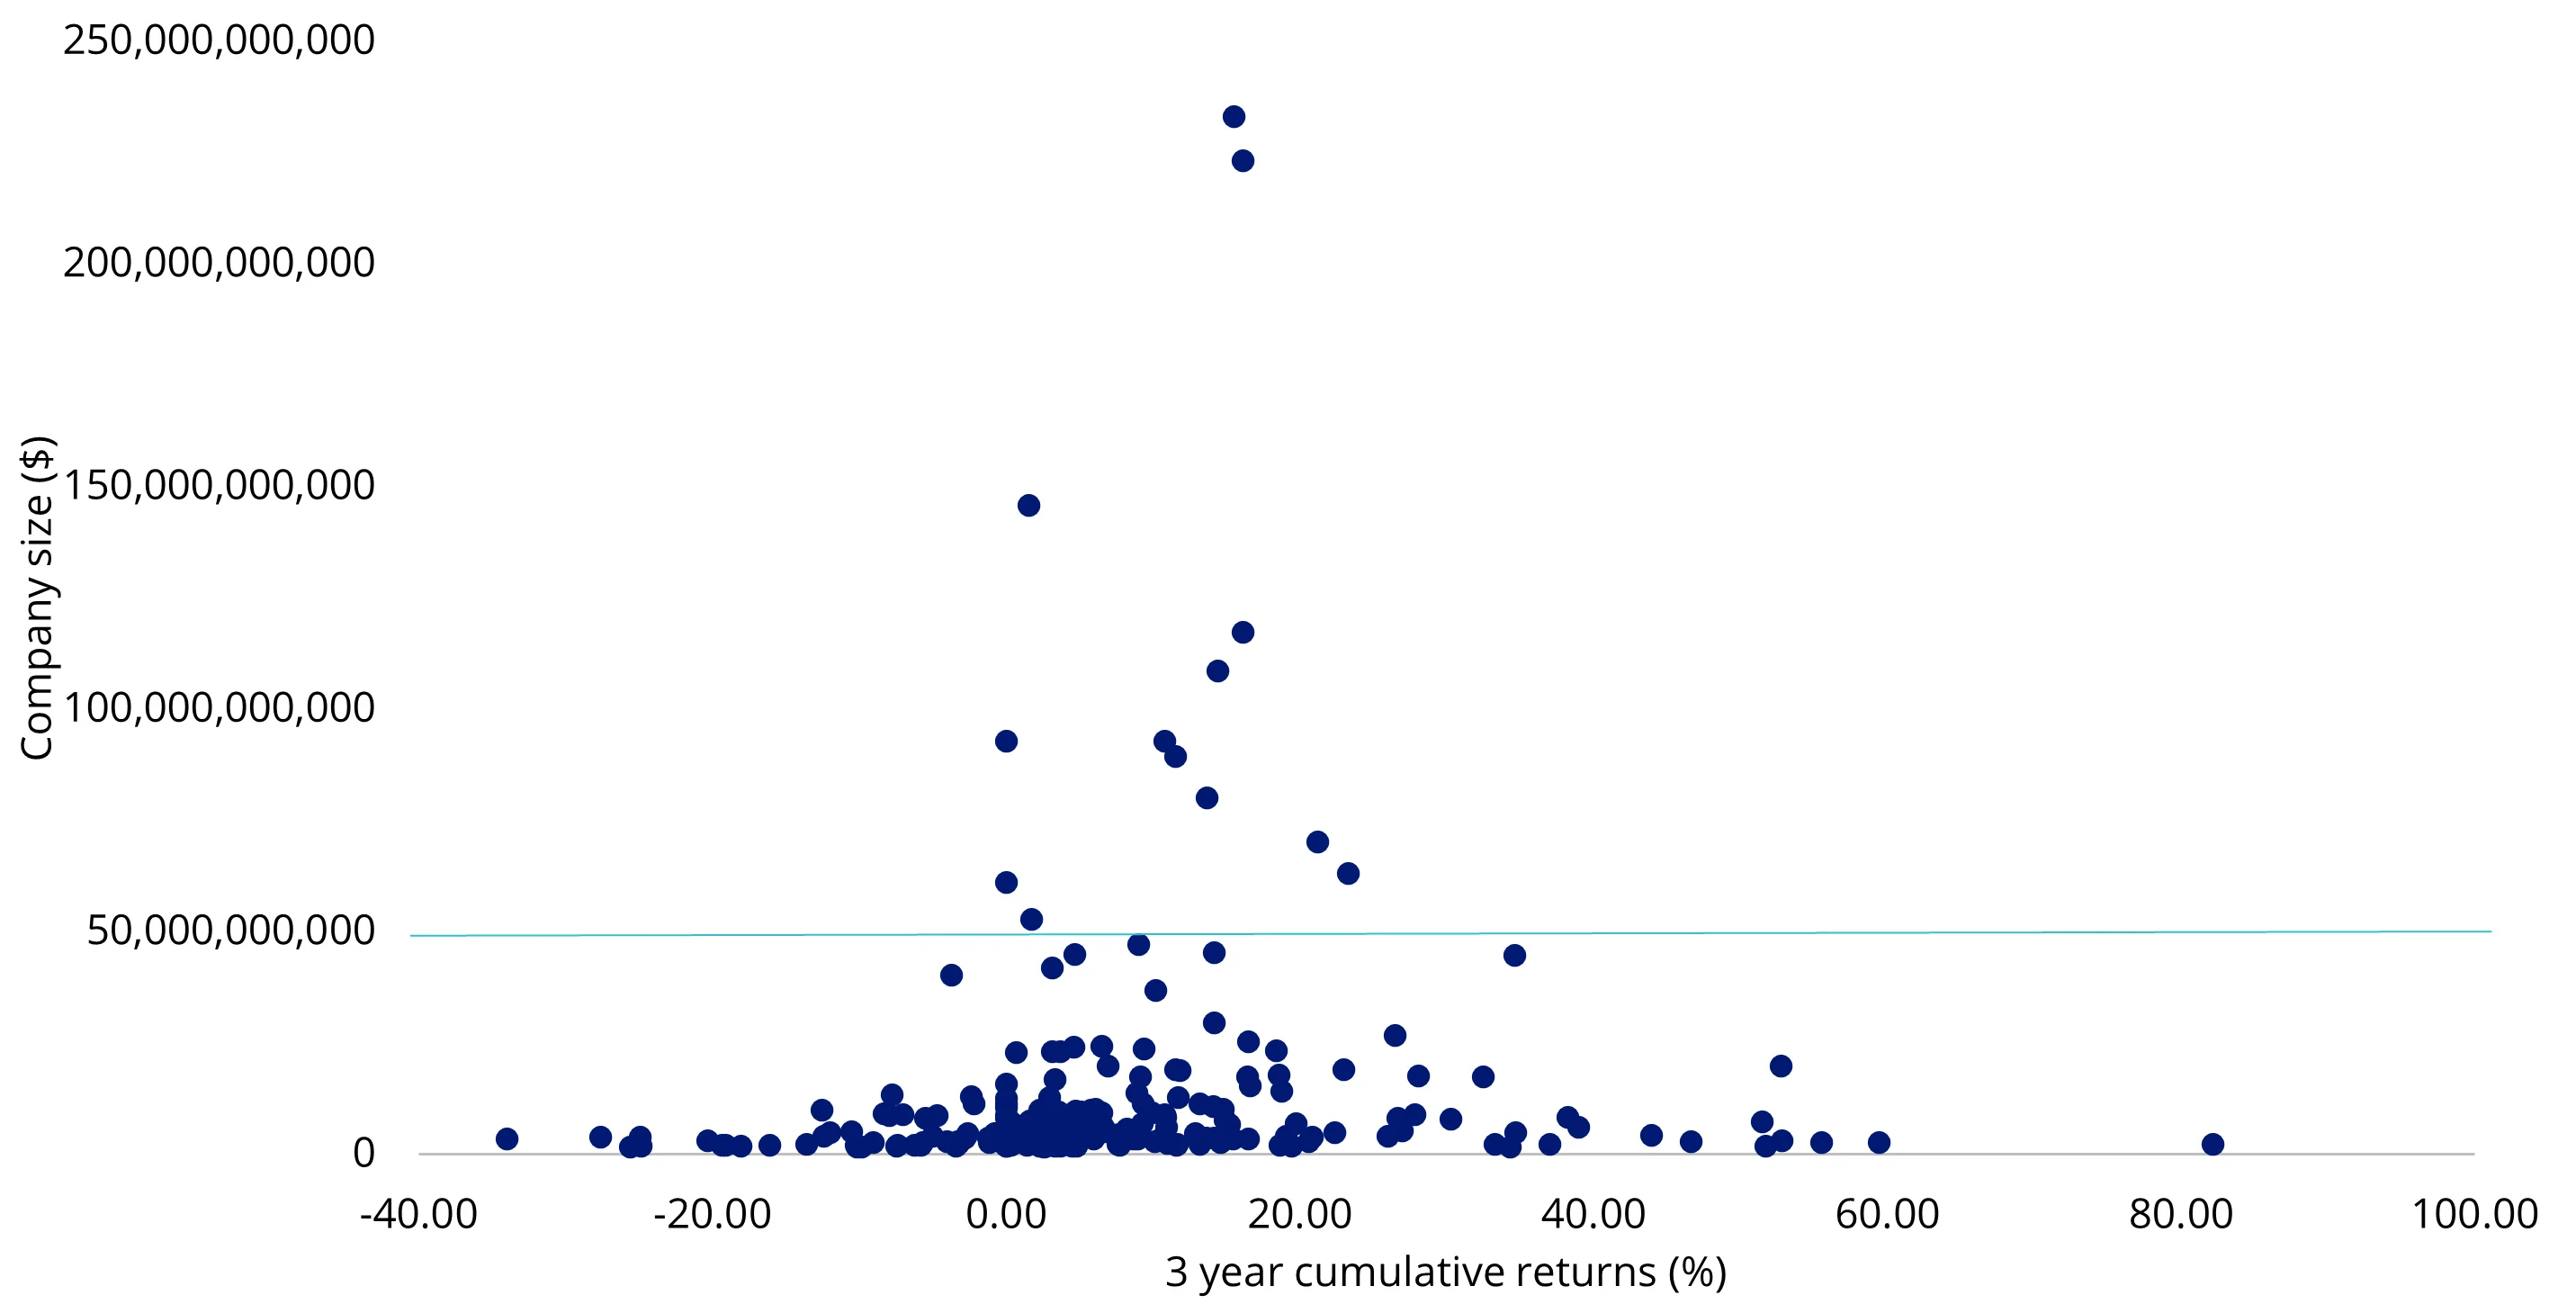
As when we wrote the paper, and now (Chart 2 below), you can see that the returns of the dots above the blue line (ie the mega-caps) are skewed to the middle/left, generally sitting between 0 and 20%. The returns of the bigger companies do not sit at the extremes beyond the 50% returns. That is the exclusive domain of companies below the line.
Chart 2: Three-year returns for the 200 largest Australian companies versus their market capitalisation

Source: Bloomberg, VanEck to 15 October 2024. Past performance is not a reliable indicator of future performance.
Therefore, the returns of Australian equities are not ergodic. The mega-sized companies that dominate Australian market capitalisation benchmarks are unlikely to be the ones with extremely high returns. It is the smaller-sized companies outside the top 10 that generate the highest returns.
This outcome has been shown repeatedly, including here: The road to recovery (revisited): Further analysis of equal weight performance after market declines.
Intuitively, it would make sense to construct a portfolio that has less exposure to the mega-caps and more exposure to the companies that are likely to experience higher returns. An evenly spread portfolio like VanEck’s Australian Equal Weight ETF (MVW), for example, is fishing with a much bigger net. MVW currently includes 72 different companies, where each company’s weighting is high enough that the rocketing share price of a company outside the top 20 won’t be lost as a rounding error.
For those interested, the best-performing mega-cap noted in chart 2 above is Fortescue Metals, which MVW had an overweight exposure to when it was smaller. Therefore, MVW benefited more from Fortescue’s growth than the market capitalisation approach. Fortescue's 24% return, though, is far less than the handful of smaller-sized companies that returned over 50% over the period such as Pro Medicus, which MVW is overweight.
Putting it into practice
You can see in the table below that MVW has benefitted from its exposure to Arcadium Lithium. Since it launched, over a decade ago, MVW has risen the fund charts to become the fourth largest broad-based Australian equities ETF on ASX. It is the largest smart beta ETF in its category and has enjoyed support from all parts of the market, from mum and dad investors to large institutions, from SMSFs to financial advisers. These investors have been using MVW to replace:
- Australian equity unlisted active funds which charges higher fees;
- LICs which are trading at discounts; or
- ASX/200 trackers to reduce stock and sector concentration risks.
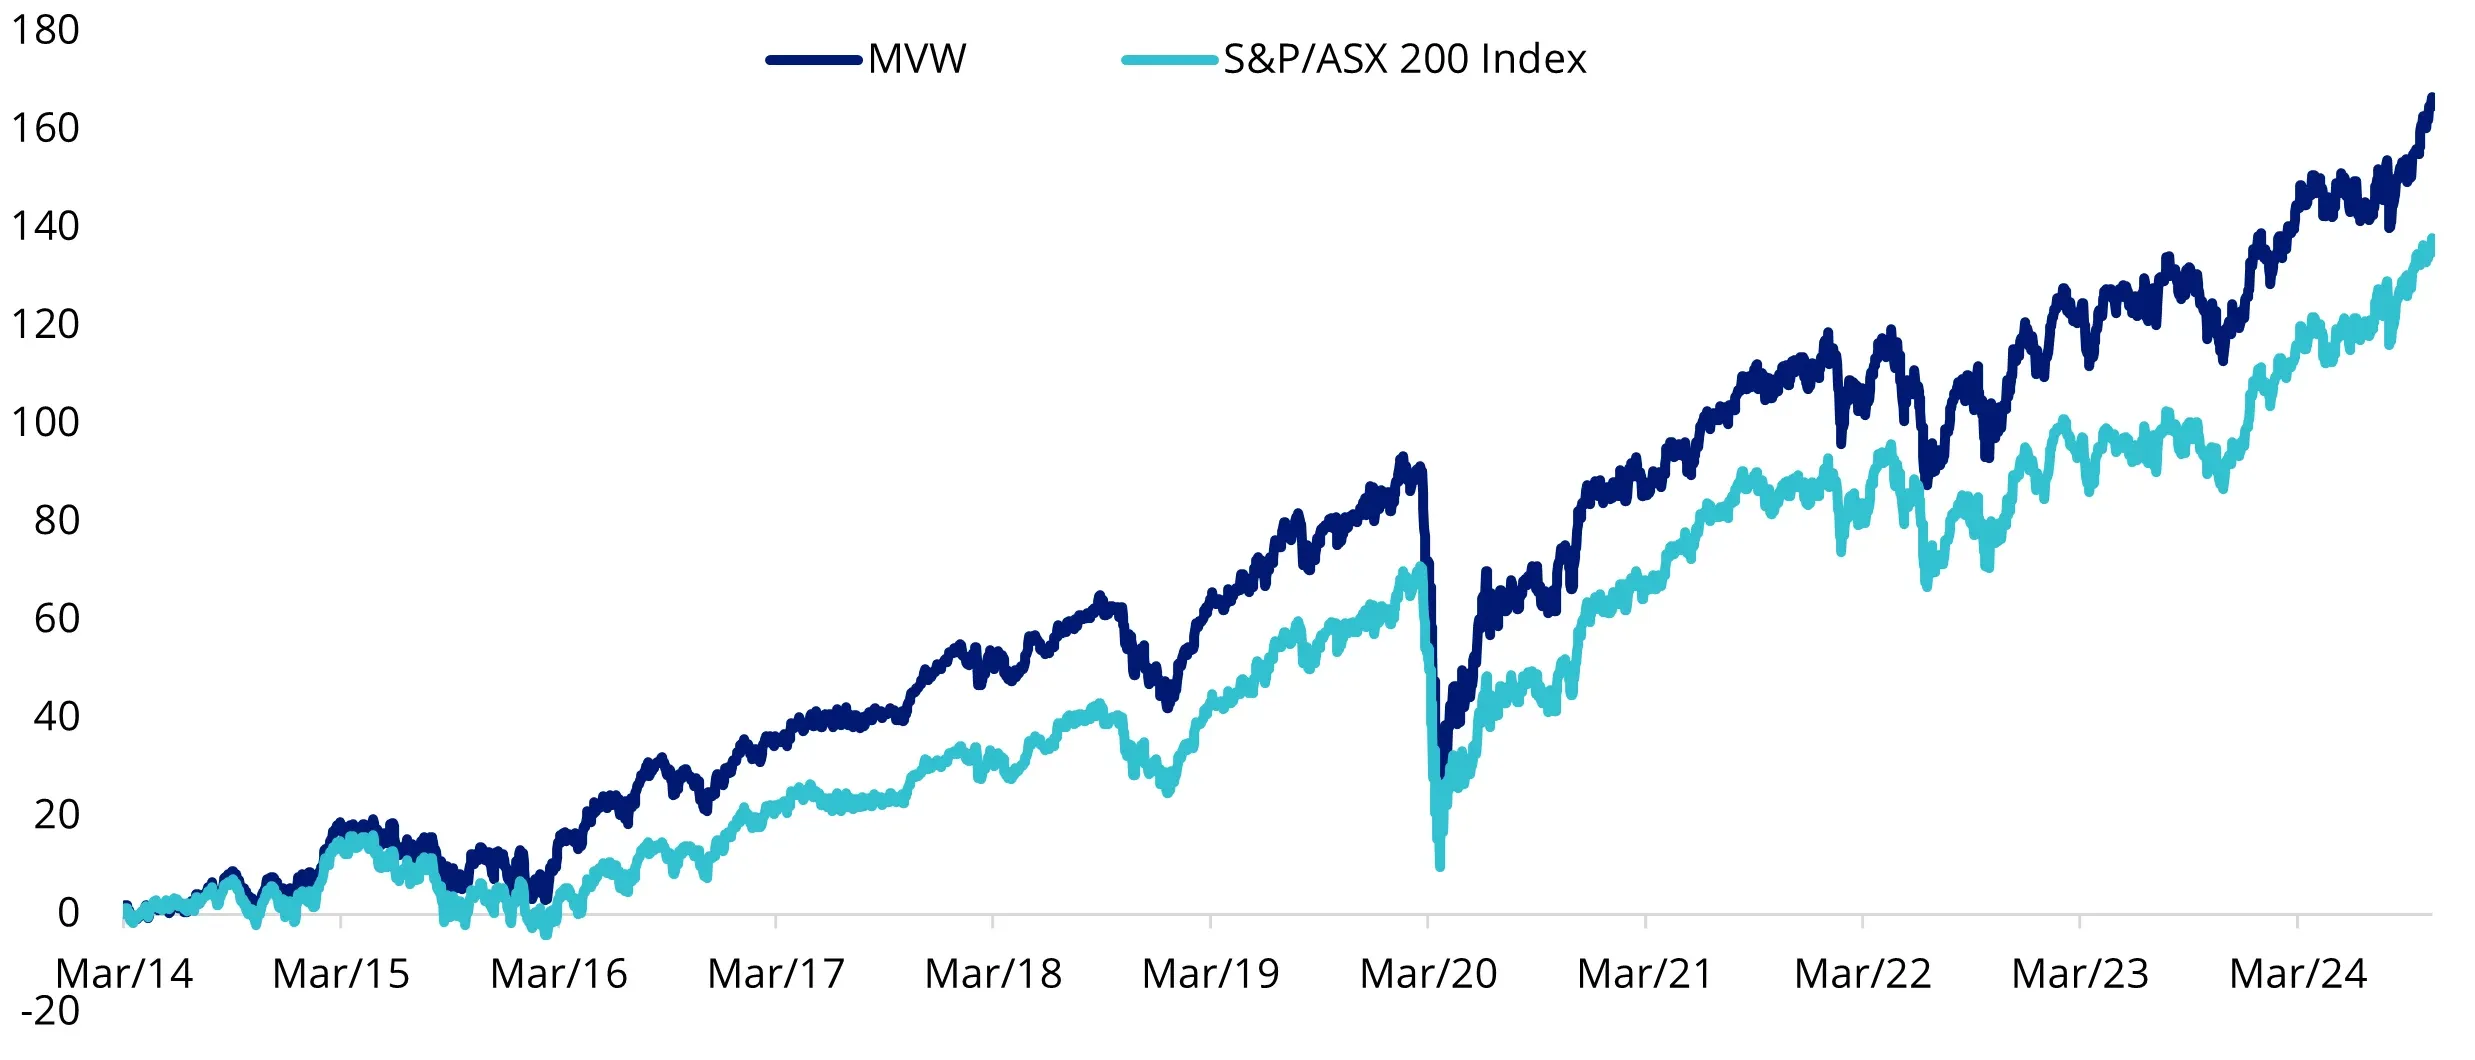
While diversification, beyond the mega-caps, is one reason MVW has been gathering assets, another is its impressive long-term performance. MVW’s performance, noted below, has been achieved for a management fee of just 35 basis points per annum, making it one of the lowest-cost investment funds in its peer group, including unlisted managed active funds.
Chart 3: Cumulative performance since MVW inception date to 17 October 2024

Table 1: Trailing performance to 17 October 2024

* MVW Inception date is 4 March 2014 a copy of the factsheet is here.
Chart 3 and Table 1 source: Morningstar Direct, VanEck. The chart and table above show past performance of MVW and of the S&P/ASX 200. You cannot invest directly in an index. Results are calculated to the last business day of the month and assume immediate reinvestment of distributions. MVW results are net of management fees and other costs incurred in the fund, but before brokerage fees and bid/ask spreads incurred when investors buy/sell on the ASX. Returns for periods longer than one year are annualised. Past performance is not a reliable indicator of future performance. The S&P/ASX 200 Index is shown for comparison purposes as it is the widely recognised benchmark used to measure the performance of the broad Australian equities market. It includes the 200 largest ASX-listed companies, weighted by market capitalisation. MVW’s index measures the performance of the largest and most liquid ASX-listed companies, weighted equally at rebalance. MVW’s index has fewer companies and different industry allocations than the S&P/ASX 200. Click here for more details.
Key risks
An investment in the ETF carries risks. These include risks associated with financial markets generally, individual company management, industry sectors, fund operations and tracking an index. See the PDS for details.
Published: 25 October 2024
Any views expressed are opinions of the author at the time of writing and is not a recommendation to act.
VanEck Investments Limited (ACN 146 596 116 AFSL 416755) (VanEck) is the issuer and responsible entity of all VanEck exchange traded funds (Funds) trading on the ASX. This information is general in nature and not personal advice, it does not take into account any person’s financial objectives, situation or needs. The product disclosure statement (PDS) and the target market determination (TMD) for all Funds are available at vaneck.com.au. You should consider whether or not any Fund is appropriate for you. Investments in a Fund involve risks associated with financial markets. These risks vary depending on a Fund’s investment objective. Refer to the applicable PDS and TMD for more details on risks. Investment returns and capital are not guaranteed.
MVIS Australia Equal Weight Index (‘MVIS Index’) is the exclusive property of MV Index Solutions GmbH based in Frankfurt, Germany (‘MVIS’). MVIS is a related entity of VanEck. MVIS makes no representation regarding the advisability of investing in the Fund. MVIS has contracted with Solactive AG to maintain and calculate the MVIS Index. Solactive uses its best efforts to ensure that the MVIS Index is calculated correctly. Irrespective of its obligations towards MVIS, Solactive has no obligation to point out errors in the MVIS Index to third parties.


