Welcome to the energy revolution.
2020 was unquestionably a defining year in history, characterised by disruption, adaptation (or lack thereof) and acceleration. It will also likely be pinpointed as the year where the groundswell of public demand, technological advancements and economic pressures culminated to reshape the global energy supply paradigm.
2020 was unquestionably a defining year in history, characterised by disruption, adaptation (or lack thereof) and acceleration. It will also likely be pinpointed as the year where the groundswell of public demand, technological advancements and economic pressures culminated to reshape the global energy supply paradigm.
Last year launched with, what would become, a harbinger for what 2020 had in store. Catastrophic bushfires ravaged Australia, causing unprecedented smoke that extended all the way to South America and became a “wake up call”1, which sharpened demand for action on climate change around the world.
US oil prices turned negative for the first time on record in 2020 and later in the year major oil producers announced that the world had now passed “peak oil” demand2,3.
2020 was also a year of historic firsts for renewable energy:
- New solar and wind projects resulted in renewables generating more electricity than fossil fuels across Europe4.
- Similarly, for the first time in history, renewable energy made up almost half of Britain’s electricity generation in the first three months of the year5.
- April 2020 was the first month ever that renewables generated more electricity than thermal coal in the United States every single day6.
The world invested an unprecedented $500 billion in decarbonisation in 20207. In addition, Boris Johnson committed £12 billion to create a “green industrial revolution” in the UK. Germany allocated €9 billion to end its reliance on coal. The soon-to-be President of the United States, Joe Biden earmarked US$2 trillion for clean energy projects. This investment trend is characteristic of many other government policies around the world.
It would seem we are at the precipice of the clean energy revolution.
We outline some of the key investment trends driving the future of the clean energy sector and the re-shaping of the global energy order.
- A dramatic upscaling of wind capacity
Onshore and offshore wind turbines are already one of the primary sources of renewable energy supply across the UK, US, Europe and China. Improved technologies, economies of scale and developer experience has resulted in significant reductions in the cost of wind power. The cost of onshore wind has reduced by almost 40% and the cost off offshore by almost 30% since 20108. Just one wind turbine can now generate enough electricity to power 1,400 homes9.
The UK has the largest installed capacity of offshore wind in the world and plans to increase production to exceed total worldwide production by 15 times within the next decade. This will be possible due to new technology, which allows wind farms to be built further out to sea in deeper waters. With this boosted capacity, the UK plans on producing enough electricity to power every home in the country by 2030.
China is also stepping up efforts in the wind energy race. Investment in wind jumped by 152% YoY in the first half of 2020, accounting for almost half of the country’s total power generation investment; the highest proportion on record. Considering China’s 2060 carbon-neutral target and 2030’s cumulative renewable target of 1,200 GW, it is expected China’s wind market will maintain momentum for the remainder of the decade10. - Solar’s rapid adoption
Along with onshore wind power, solar power is increasingly undercutting existing coal-fired plants on cost, and auction results show this trend accelerating11. Solar power has two forms, solar photovoltaic (PV) which refers to solar panels that convert sunlight into electricity (like what you see on top of roofs) and concentrating solar power (CSP) which rely on mirrors or lenses to concentrate light to create heat which is then tuned into energy. The cost of PV and CSP solar has dropped off a proverbial cliff, falling by around 80% and 50% respectively in the last decade.
In China, home to the world’s largest solar farm, solar is seeing unprecedented growth in terms of adoption.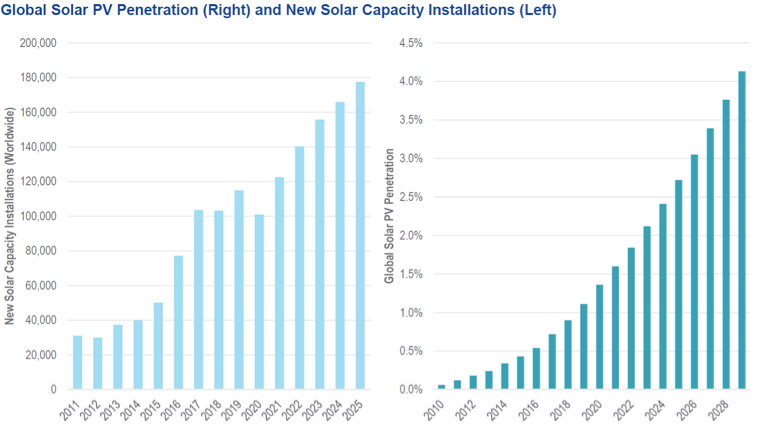
Source: CLSA. Data as of November 2020.
Similarly, the US solar energy market is expected to grow at a CAGR of 17.32% during 2020-2025, buoyed by supportive government policies12. - The green hydrogen catapult
Green hydrogen could supply up to 25% of the world’s energy needs by 2050 and become a US$10 trillion addressable market by 2050, according to Goldman Sachs.
While grey hydrogen (made from fossil fuels) and blue hydrogen (the same as grey but carbon capture processes are used to prevent CO2 being released) currently cost a fraction compared to their green counterpart, the expectation is this cost disparity should rapidly decline in the coming years due to economies of scale and advances in technology. This is the aim of the recently announced Green Hydrogen Catapult Initiative. Seven of the world’s green hydrogen leaders have joined forces to drive down costs to below US$2/kg and accelerate the scale and production of green hydrogen 50-fold in the next six years14.
In addition, annual global investments in green hydrogen are expected to exceed US$1 billion by 2023, according to a recent report by HIS Markit. Many countries have published national hydrogen strategies, including Australia, Chile, Japan, New Zealand, Spain, South Korea and Germany. Germany is already using green hydrogen as a key replacement for coal.
As government and private investment in clean energy is accelerating, divestment away from fossil fuels is also gathering pace. Norway’s sovereign wealth fund began drawing its line in the sand against fossil fuels in 2019 and since then, a slew of the world’s largest pension and superfunds have followed suit. The tide has well and truly changed.
Australia’s first global clean energy ETF will be available on ASX in the coming weeks.
To find out more about the VanEck Vectors Global Clean Energy ETF (ASX: CLNE) and to register your interest for more information, click here.
- https://www.cbsnews.com/news/australia-bushfires-a-wake-up-call-to-the-world-says-united-nations-scientist-60-minutes-2020-02-14/
- New York Times, Shell, in a Turning Point, Says Its Oil Production Has Peaked, 11 February 2021
- BP Energy Outlook 2020, September 2020
- https://www.forbes.com/sites/davidrvetter/2021/01/25/its-official-in-2020-renewable-energy-beat-fossil-fuels-across-europe/?sh=7e75367760e8
- https://www.theguardian.com/business/2020/jun/25/renewable-energy-breaks-uk-record-in-first-quarter-of-2020
- https://www.ecowatch.com/renewables-surpass-coal-2646007462
- https://about.bnef.com/blog/energy-transition-investment-hit-500-billion-in-2020-for-first-time/
- International Renewable Energy Agency, Renewable Power Generation Costs in 2019
- https://www.ovoenergy.com/blog/green/20-fascinating-renewable-energy-facts.html
- https://www.greentechmedia.com/articles/read/what-is-going-on-with-chinas-crazy-clean-energy-installation-figures
- https://www.irena.org/newsroom/pressreleases/2020/Jun/Renewables-Increasingly-Beat-Even-Cheapest-Coal-Competitors-on-Cost
- https://www.globenewswire.com/news-release/2020/08/31/2085905/0/en/The-United-States-solar-energy-market-is-expected-to-grow-at-a-CAGR-of-17-32-during-2020-2025.html
- https://www.iea.org/reports/renewables-2020/solar-pv#abstract
- https://racetozero.unfccc.int/green-hydrogen-catapult/


Published: 26 February 2021