Overcoming confirmation bias in investing
Confirmation bias occurs when someone interprets or cherry-picks information consistent with their beliefs. It occurs in politics, business and sports. It is also rife in funds management.
We can all think of examples of confirmation bias in everyday life. It occurs in politics, business and sports. It is also rife in funds management. It’s important to look for data that not only allows you to test whether your hypothesis is right, but also whether it is wrong.
Most Australian portfolios include funds that utilise active managers. Actively managed funds aim to outperform the fund’s benchmark index. If the benchmark index returns 10%, the fund aims to return more than 10%. If the benchmark index falls 10%, the fund’s goal is to fall less than 10%. To outperform a benchmark index an active fund manager will buy stocks they think will perform better than the rest of the benchmark index and sell, or not hold, stocks that they think will perform worse than the rest of the benchmark index. It has been well documented that many active fund managers do not outperform their benchmark index.
Over a decade ago S&P Dow Jones started its half-yearly S&P Indices Versus Active (SPIVA) reports challenging the premise that with enough active management skill, it’s easy to consistently outperform the benchmark index. SPIVA reports have made for poor reading for active managers who have shifted the debate to highlight skill during specific market periods, for example highlighting past outperformance in a downturn. They highlight their ability to avoid certain ‘dogs’ in a benchmark. They also highlighted their ‘style’, which up until recently could not be done for passive fees.
While SPIVA furthered the passive versus active debate it did little to shift an industry bedded to the ideology that markets are inefficient and therefore active managers should be able to add value above the benchmark index, even accounting for fees, over time.
In response S&P Dow Jones Indices now release accompanying research, ‘Persistence of Australian Funds’, as part of its SPIVA program. What these reports show is that there is a cohort of funds in which active managers justify their fees. It also shows however that, for investors, it is difficult to pick an active manager who will persistently outperform, because most do not.
While all this was happening, technological advances, the availability of big data combined with the general growth in the asset management markets, enabled better performance analysis. It was observed that an active manager’s returns could be attributed to the market (beta), skill (pure alpha) and a range of what are known as smart beta factors. These factors are similar to the ‘styles’ active managers promote as a part of their skill-set. Smart beta indices and ETFs made it possible for investors to invest in strategies that utilise these same factors, for a fraction of the cost that active managers have historically been charging.
The technological data has also made it possible to assess an active manager’s skill and their adherence to a style. There are a number of factor models and below we take you through the Fama French Five Factor Model and show its use assessing our smart beta VanEck Vectors MSCI World ex Australia Quality ETF (QUAL) which as you would expect demonstrates the ‘quality factor’ and then compare it to the model of an active manager to dissect its performance.
|
Fama French Five Factor Model Formula Rit - Rft = αit + β1 (Rmt - Rft) + β2SMLt + β3VMGt + β4RMWt + β5CMAt + ϵt Where, Rit = total return of a portfolio i at time t Rft = risk free rate of return at time t Rmt = total market portfolio return at time t SMLt = size premium (small minus large) VMGt = value premium (value minus growth) RMWt = profitability premium reclassified as the quality premium CMAt = investment conservatism premium reclassified as the momentum premium β1,2,3,4,5 = factor coefficients |
Don’t worry you don’t need to be a mathematician to understand the model. The model is visual. It breaks down returns over rolling 36 months. In the international equities examples in addition to the Fama French Five Factor Model we use the MSCI factor indices to explain the past returns.
Model Interpretation
The visual model is presented in five sections:
- R-squared - this is the percentage contribution to performance;
- Fund relative to benchmark return;
- Factor + alpha;
- Factor plus alpha coefficient; and
- Factor coefficients.
Now let’s looks at QUAL.
Figure 1: QUAL’s five-factor model
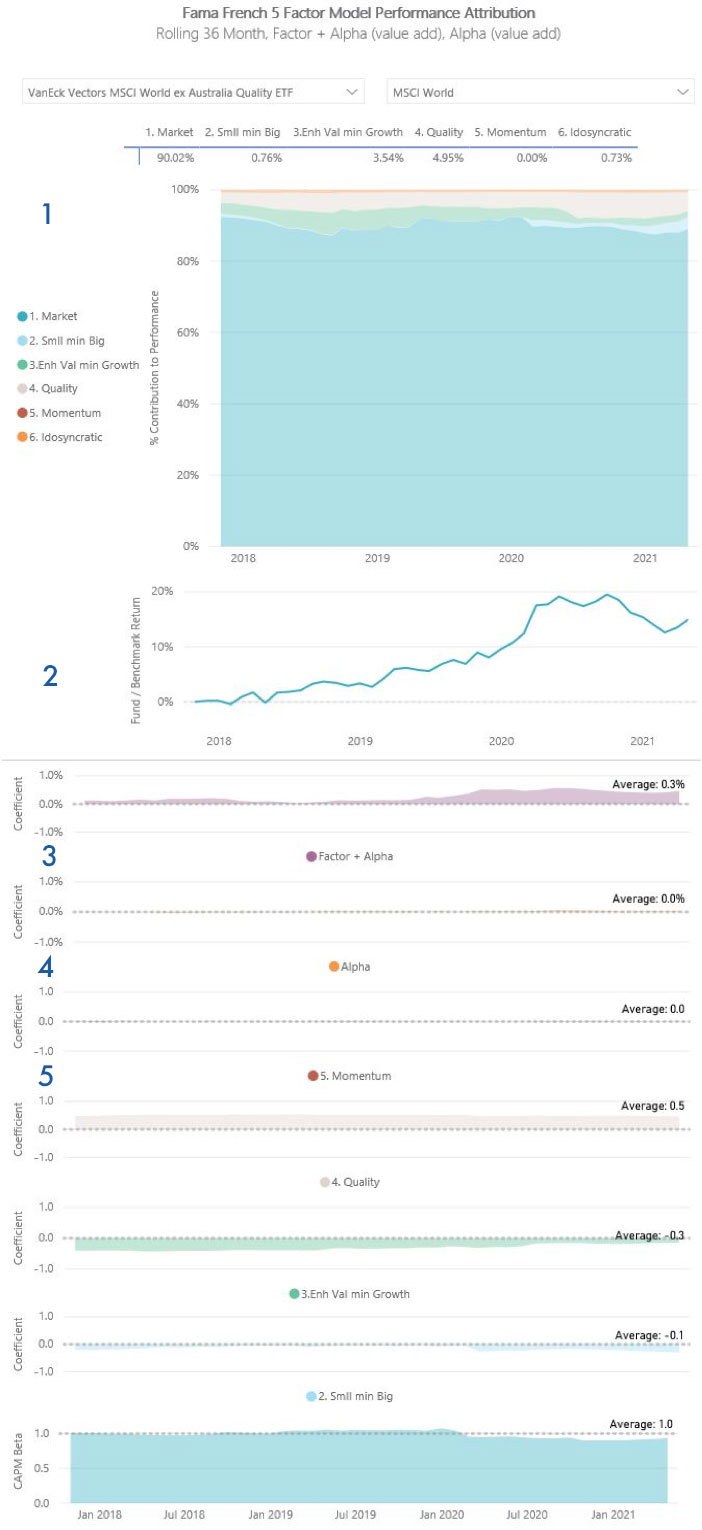
Source: Vaneck, MSCI, 5 years to March 2021. Results are calculated to the last business day of the month and assume immediate reinvestment of all dividends. QUAL performance includes management fees and other costs incurred in the fund but excludes broker fees and buy/sell spreads associated with investing in QUAL. Past performance is not a reliable indicator of future performance of the QUAL.
1 – R-squared – is a statistical measure that quantifies the percentage of active managers’ performance attributed to the market and factor exposures. The best way to conceptualise this component is using the ‘onion layers’ analogy. Think about the above, as each factor is added. The r-squared value for that factor quantifies the additional contribution opposed to the total percentage contribution.
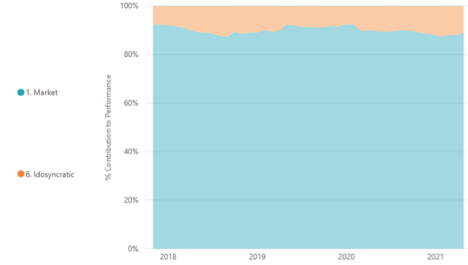
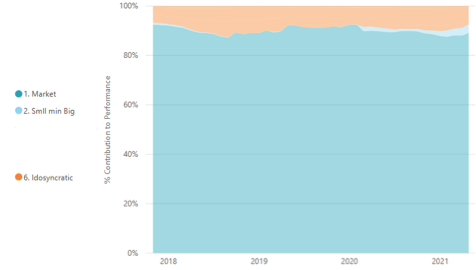
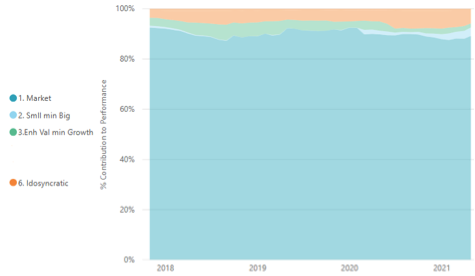
Figure 2: The layers of the five factor model:
Layer 1: The ‘market’ explains 90.0% of performance. When the market rises, so does QUAL.
Layer 2: Size plus market beta explains 90.8% (90.0%+0.8%) of performance. QUAL does not have a significant bias to small companies.
Layer 3: Value/growth plus size plus market beta explains 94.3% (90.0%+0.8%+3.5%) of performance. QUAL has greater exposure to growth over value.
Quality plus value/growth plus size plus market beta explains 99.3% (90.0%+0.8%+3.5%+5.0%). Quality is by far the biggest ‘factor’ exposure.
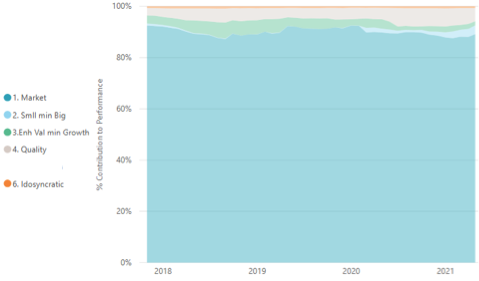
Source: VanEck, Delta Research & Advisory, MSCI, 5 years to March 2021
In summary, the model shows QUAL performs as you would expect it to. Quality is the dominant factor and this has been persistent through time.
2 – Relative performance – In figure 1 you can see that QUAL has consistently outperformed the benchmark. Toward the end of 2020 the line starts to dip as value makes a comeback, but QUAL has since turned back upwards.
3 – Factor + alpha – This purple chart shows whether the fund has out/underperformed the benchmark on a 36 month rolling basis. You can see QUAL is currently above 0%, so it is currently outperforming the market, as it has for much of the time since its launch on ASX.
4 – Alpha – This is the pure alpha added, beyond factors and the market. As there is no active manager making decisions for QUAL so, as you would expect you can barely see an orange line
5 – Factor coefficients – The coefficients quantify whether the factor contribution is large/small, value/growth, quality and/or momentum. The coefficients show that QUAL has a quality, growth and large cap tilt as the coefficients are positive, negative and negative respectively. This has been consistent since the funds ASX listing.
Now let’s look at the five factor model of one of the largest active global equity funds in the market.
Figure 3: An active funds’ five-factor model
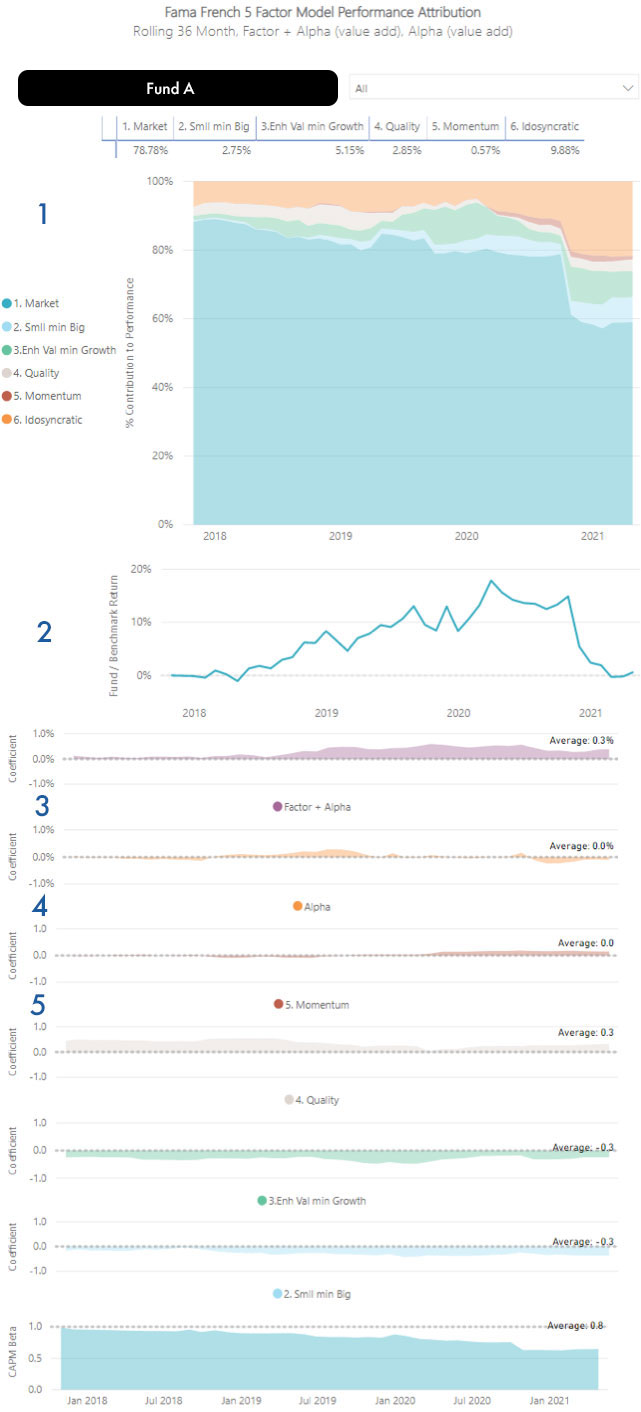
Source: Vaneck, Delta Research & Advisory, MSCI, 5 years to March 2021. Results are calculated to the last business day of the month and assume immediate reinvestment of all dividends. Fund A’s performance includes management fees and other costs incurred in the fund but excludes broker fees and buy/sell spreads associated with investing in Fund A. Past performance is not a reliable indicator of future performance of Fund A.
1 - R-squared – what is immediately noticeable is that much of the performance was attributable beyond factors and beta. In other words, assuming the fund manager was outperforming, their fees were justified - they were adding performance beyond factors and the market. This is skill. The reverse is true is the fund manager is underperfoming. You can see that recently this 'idiosyncratic' phenomenon has increased.
2 – Relative performance – In figure 3 you can see that this active fund has outperformed for most of the past five years. Notably there is a big fall, similar to QUAL, at the end of 2020. This fund however has not recovered as well as QUAL. This period of underperformance corresponds to a period that stood out in the r-squared analysis. They way the fund performs has changed. It's worthwhile trying to find out why by analysing alpha and factors.
3 – Factor + alpha – This purple chart shows that this fund has outperformed.
4 – Alpha – A good active manager would experience orange consistently above the line as this is the pure alpha added, beyond factors and the market. You can see that this manager has experienced some orange above the line, but has recently struggled to add value beyond factors. Pure alpha went negative last year.
5 – Factor coefficients – This is where it gets interesting. The coefficients show us that for much of the last five years this fund was managed similar to QUAL in that it had a large quality, growth and large cap tilt as the coefficients were positive, negative and negative respectively. But there is a noticeable dip away from quality in 2020. There is also less correlation to the market (CAPM Beta). These changes correspond to this fund manager’s underperformance over the past 12 months.
Investors with a confirmation bias, concerned about recent underperformance would cite the outperformance in the past as evidence of an expected turnaround. Given the fund has done well in previous downturns because of its previous quality exposure it could be expected to do well again. Someone citing this data might even use the phrase “mean reversion”.
But if you are seeking information that disproves this bias, the above analysis shows that Fund A has shifted from its proven quality bias. The modelling illustrates that Fund A’s outperformance through 2015 to 2020 was achieved from a combination of quality and skill. But the portfolio has changed: where QUAL which maintained its quality exposure and has subsequently experienced a performance upturn, this has not occurred in Fund A. This data invalidates the bias. Investors in this fund should be seeking clarity on the changes to the fund’s investment style and determine if this fund would perform the same role in their portfolio as it did when they first invested.
Big data allows for this type of analysis and it is a powerful tool to overcome confirmation bias.
|
* – Confirmation bias experiment: Confirmation bias is demonstrated by the classic experiment known as the Wason Card Task. Participants are presented with four cards on a table and are told that each card has a letter on one side and a number on the other. Participants can see one vowel, one consonant, one odd number and one even number facing up (eg, A, B, 1, and 2). Participants are asked to test this hypothesis: “If a card has a vowel on one side, it has an even number on the other.” They can only turn over two cards to determine whether the hypothesis is true. Most people turn over the vowel but then turn over the even number even though both actions will prove the hypothesis, not disprove it. The correct answer is to turn over the vowel (which must reveal an even number, for the rule to be valid), and the odd number (which must NOT reveal a vowel, in order for the rule to be valid). People only seek evidence to confirm a theory, at the expense of evidence that could prove it to be false. This is confirmation bias. |


Published: 07 May 2021
VanEck Investments Limited ACN 146 596 116 AFSL 416755 (‘VanEck’) is the responsible entity and issuer of units in the VanEck Vectors MSCI World ex Australia Quality ETF (QUAL). This is general advice only, not personal financial advice. It does not take into account any person’s individual objectives, financial situation or needs. Read the PDS and speak with a financial adviser to determine if the fund is appropriate for your circumstances. The PDS is available here
An investment in QUAL has risks, including possible loss of capital invested. QUAL carry risks associated with: financial markets generally, individual company management, industry sectors, ASX trading time differences, foreign currency, country or sector concentration, political, regulatory and tax risks, fund operations and tracking an index. See the PDS for details. No member of the VanEck group guarantees the repayment of capital, the payment of income, performance, or any particular rate of return from either fund.