How healthy is healthcare?
Healthcare companies, and pharmaceuticals in particular, have earned well-deserved goodwill around the world in the last year. However, for the stock prices of most the world’s largest healthcare companies, including most of the COVID-19 vaccine developers, manufacturers and distributors, the story has been quite different. Are health care companies now good value?
Health care companies, and pharmaceuticals in particular, have earned well-deserved goodwill around the world in the last year. However, for the stocks of most the world’s largest healthcare companies, including most of the COVID-19 vaccine developers, manufacturers and distributors, the story has been quite different.
Since March 2020, the S&P Global 1200 Health Care Index has gained only 7%, trailing all S&P global sectors except for consumer staples (0% return), real estate (+5%) and utilities (-4%), all of which are considered either defensive or income-oriented sectors, seldom associated with strong global economic growth.
Despite years of delivering solid financial results and strong shareholder returns, global health care stocks have trailed not only the 2020 lockdown darlings such as communication services (+27%) and information technology (+38%) but also the reopening trade stocks favored by investors more recently, such as consumer discretionary (+35%), energy (+27%), financials (+26%), industrials (+30%) and materials (+43%)1, as illustrated in Figure 1.
Figure 1. Cumulative 1-year price returns of S&P Global 1200 sectors
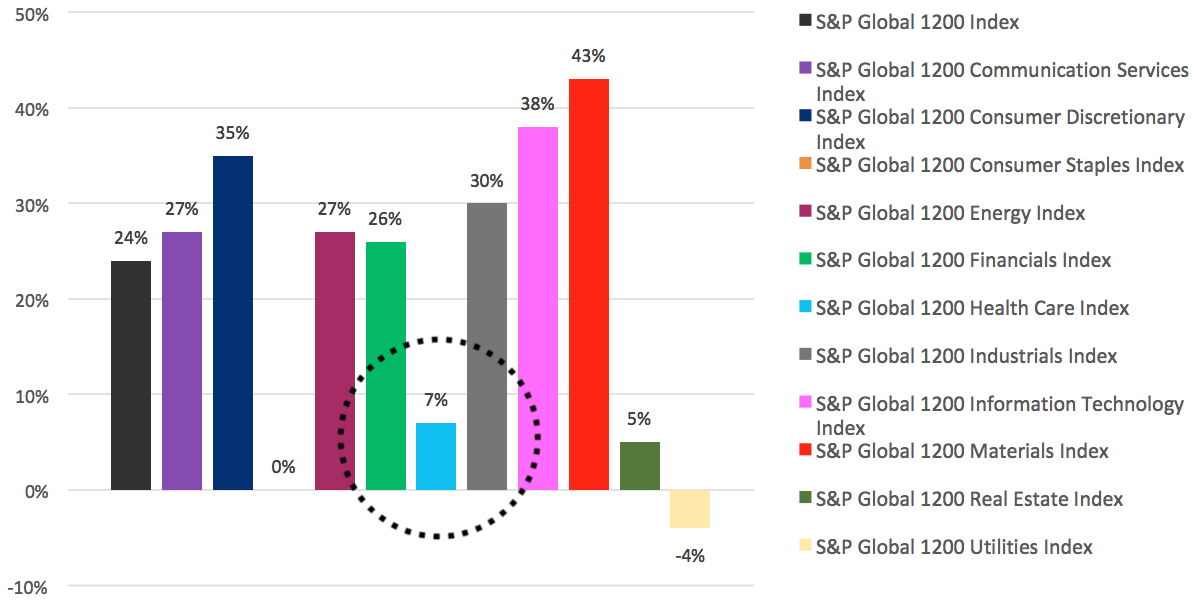
Source: Bloomberg, S&P. Cumulative price returns, in AUD, normalised as of September 18, 2020 through March 26, 2021 You cannot invest directly in an index. Past performance is not a reliable indicator of future performance.
While many of the 2020 gains that favoured technology, communications and stay-at-home trades are pretty easy to understand in retrospect, the exclusion of health care from the “reopening” trade of the last six months is perhaps harder to swallow for investors in the sector, especially when you consider that gains for a sector as beleaguered as energy have topped 36% since September. This is despite massive write-offs in the value of oil reserves by the large, integrated oil & gas companies. It’s true that many of those companies have significant dividend payouts, which are defensible with oil hovering around US$60 a barrel, but other cyclical areas have seen substantial gains in the last six months as well, with financials up 30%, industrials up 17% and materials up 15%. Global health care, meanwhile, gained only 2% in the last six months2, as seen in Figure 2.
Figure 2. Cumulative 6-month price returns of S&P Global 1200 sectors
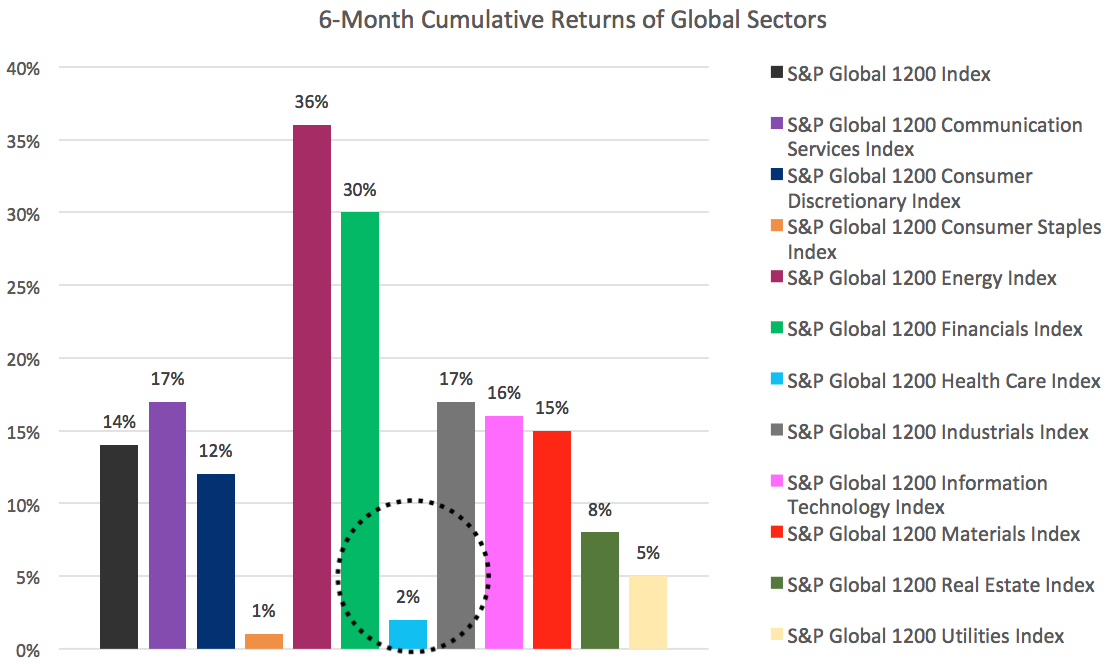
Source: Bloomberg, Cumulative price returns, in AUD, normalised as of September 18, 2020 through March 26, 2021. You cannot invest directly in an index. Past performance is not a reliable indicator of future performance.
The MarketGrader Developed Markets (ex-Australia) Health Care Index, which tracks some of the developed world’s best health care companies according to its own GARP-based selection methodology, has fared better in the last year, but has done little in the last six months. Since March 20, 2020, the Index gained 12% (price-only), compared to the benchmark’s return of 7%. In the last six months, however, it has earned no return at all compared to a 2% price gain for the S&P 1200 Global Health Care Index. The constituents of the MarketGrader Index, which recently completed its latest semi-annual reconstitution and rebalance, have grown their earnings by 24% per year, on average, in the last three years, suggesting it might be poised to rebound after the lackluster relative performance of the last six and 12 months.
Finding value in global health care
To be certain, the companies in the MarketGrader Developed Markets (ex-Australia) Health Care Index (MarketGrader Index) are not the cheapest stocks in the sector when looking simply at price to earnings ratios. The average and median forward P/E ratios for the 50 stocks in the index are currently 29 and 23, respectively, whereas the large global pharmaceutical companies trade at an average forward P/E of 14 times next year earnings per share3. Importantly, their growth rates aren’t the same either, as MarketGrader tends to select companies with higher growth rates than the average instead of pure value plays based on low valuation multiples. Furthermore, only 30% of the MarketGrader index is in pharmaceuticals, among the cheapest areas of health care, while over 50% of its constituents are in biotechnology and medical specialties companies, which often have higher P/E ratios—and also higher growth rates.
A useful way to evaluate the value investors are getting with an exposure to the MarketGrader Index is to look at the free cash flow generated by its constituents relative to the market value of the stocks. More specifically, MarketGrader measured each company’s trailing 12-month free cash flow relative to its enterprise value, a sum of its market capitalisation and its net debt, also known as free cash flow yield. Keep in mind that free cash flow refers to all of the cash generated by the business after accounting for capital expenditures. By using enterprise value in the denominator, MarketGrader’s measure of free cash flow yield takes into account the company’s debt, resulting in a more conservative measure of what investors are paying for (since owners of the company’s debt also have an indirect claim on future cash flows). The average free cash flow yield for the 50 companies in the MarketGrader Developed Markets (ex-Australia) Health Care Index is 3.8, in line with prodigious free cash flow generators such as Apple (3.6), Microsoft (3.0), or Google (3.6). Coca-Cola, a more pedestrian comparison, currently trades at a free cash flow yield of 3.7. On the other end of the spectrum, among some of the big growth names popular with investors until recently, free cash flow yields are often near zero, thanks to a combination of relatively meager free cash flow (numerator) and massive valuations (denominator). A few examples include Tesla (0.3), Square (0.2), Roku (0.1) and Shopify (0.3). For additional perspective, the 50 companies that make up the MarketGrader index have grown their free cash flow at an average rate of 21% per year in the last three years. This is illustrated in Figure 3, along with a few other growth and quality metrics for the index.
Figure 3. Select Fundamental Metrics for MarketGrader DM (ex-Aus) Health Care Index
|
Growth, Value & Quality Metrics
|
MarketGrader DM (ex-Aus) Health Care Index
|
|
Annual Free Cash Flow Growth – 3 Yr Avg
|
21%
|
|
Annual Sales Growth – 3 Year Avg
|
16%
|
|
Annual Operating Income Growth – 3 Yr Avg
|
19%
|
|
Annual Net Income Growth – 3 Yr Avg
|
56%
|
|
Average Free Cash Flow Yield
|
3.8
|
|
Average Return on Invested Capital
|
22%
|
|
Average Economic Value Added
|
16%
|
|
Trailing P/E Ratio - Median
|
32
|
|
Forward P/E Ratio - Median
|
23
|
Sources: FactSet, MarketGrader
Some of the cyclical sectors enjoying their moment in the sun could well continue to shine as the reopening of global economies gains momentum and nominal growth returns. Investors wondering whether they may have missed the reopening trade or the growth to value rotation could do worse than to increase their exposure to a sector that has not only done well in growth and value markets, but also has very strong demographic tailwinds at its back as global populations age and consumer demand for health care increases.
This blog originally appeared here.
(Note: all returns presented in this article are calculated in AUD)


Published: 09 April 2021
Important information
VanEck Investments Limited ACN 146 596 116 AFSL 416755 (‘VanEck’) is the responsible entity and issuer of units in VanEck ETFs. This is general advice only, not personal financial advice. It does not take into account any person’s individual objectives, financial situation or needs. Read the PDS and speak with a financial adviser to determine if a fund is appropriate for your circumstances.
"MARKETGRADER" and “MARKETGRADER DEVELOPED MARKETS (EX-AUSTRALIA) HEALTH CARE INDEX” are trademarks of MarketGrader.com Corp. and have been licensed for use for certain purposes by VanEck. HLTH is based on the MARKETGRADER DEVELOPED MARKETS (EX-AUSTRALIA) HEALTH CARE INDEX, but is not sponsored, endorsed, sold or promoted by MarketGrader, and MarketGrader makes no representation regarding the advisability of investing in HLTH.
1Cumulative price returns, in AUD, normalized as of March 27, 2020 through March 26, 2021. Source: Bloomberg.
2Source: Bloomberg. Cumulative price returns, in AUD, normalized as of September 18, 2020 through March 26, 2021
3Source: Barron’s – “Big Pharma Battled the Pandemic. The Stocks Are Cheap.” March 12, 2021.