Fractal geometry and finance: You're doing risk wrong
The assumptions behind risk models such as the capital asset pricing model (CAPM) and modern portfolio theory (MPT) which underpin most standard market capitalisation based portfolios - are wrong.
Enter fractals. If you haven’t heard of them, that’s OK. An appreciation of fractal mathematics can help investors understand periods of extreme risk and to better consider how their portfolios are positioned.
Benoit Mandelbrot was a mathematician and is most famous for his contributions to the field of fractal geometry. Fractal geometry is about identifying repeating patterns to explain a whole part. It does this by breaking something into much smaller parts, each an echo of the whole. Using mathematics Mandelbrot was then able to create a measure of roughness. Mandelbrot extended this field of mathematics to explain patterns in nature.
Roughness occurs throughout nature. Examples of varying roughness include the shape of mountains, coastlines, rivers and the size and location of weather patterns. Mandelbrot was able to identify that “the Australian coastline, less rugged than the Cornish, turns out to have a fractal dimension of 1.13. By contrast the smooth South African shore has dimension of 1.02, only slightly higher than a straight line.”
What we can now quantify, is not a measure of length, heat or loudness, but how convoluted and irregular something is. A measure of roughness.
Think of a mountain range. It has peaks and troughs. To measure the roughness, you break down each rise and fall.
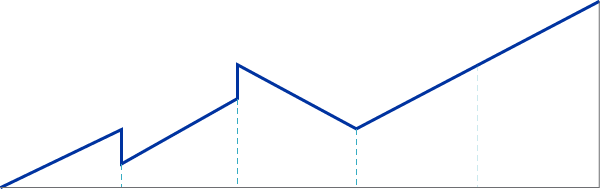
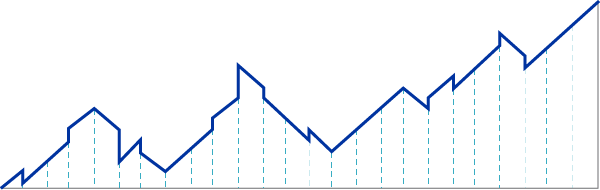

Looking at the above, Mandelbrot, thought the pattern looked familiar. Having studied the price movements of cotton earlier in his career, he wondered if he could use fractals to explain the movements in markets.
In 2004 when Mandelbrot first released The Misbehaviour of Markets: A Fractal View of Financial Turbulence, it was largely ignored. The GFC, which followed shortly after highlighted the false assumptions of many risk models used in finance. Risk models such as the capital asset pricing model (CAPM) and modern portfolio theory (MPT) which were built on the assumption of the standard bell curve which assumes that prices move randomly in a ‘normal’ range reigned, as they still do, albeit with a few tweaks. Extreme events, despite occurring, are still considered so rare they essentially don’t exist.
For example, Bryce James (2017)1of Smart Portfolios calculates that by using the bell curve, the daily price movement of -22.61% of the S&P 500 on Black Monday in October 1987 was a one in 377,928,949,357,521 + 25 more zeroes year event. More recently, the 7.87% fall of the S&P 500 on the worst day of 2018 was a one in 7,348,618,460 year event. There were two other days with similar moves in that year.
Seven worst days (in 30 years) and the probability of loss (Gaussian Bell Curve)
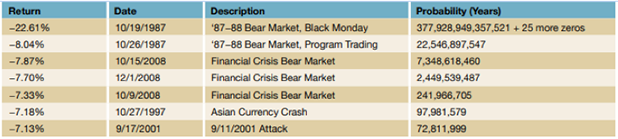
Source: Revisiting Modern Portfolio Theory, Investments & Wealth Monitor, 2017
These unbelievable results demonstrate that the bell curve is not a good representation of price fluctuations. James asks “At what point do we raise the white flag and surrender normal distribution?”
Another assumption of MPT is that price changes are statistically independent of one another, so today’s price will have no influence on the changes between the current price and tomorrow’s. Mandelbrot illustrated this is not correct. Mandelbrot found that price changes are not independent of one another, rather they have a ‘memory’ and today’s price will influence tomorrow’s. Further, he found that trouble runs in streaks.
Mandelbrot found that large price changes tend to be followed by large price changes, positive or negative. Small changes tend to be followed by more small changes. Volatility is concentrated in small packages of time. Market swings ‘cluster’ together, interspersed with periods of more sedated price variations.
Applying Mandelbrot’s work to investments
Utilising his work in fractals, Mandelbrot created market simulations that matched the characteristics of financial markets. While his charting could not be used to predict price movements, an understanding of his work can help appreciate that markets are more risky than standard theories imagine. So traditional risk management strategies should be reconsidered as they are: theoretical.
Mandelbrot argued for better research to “understand, in much closer fidelity to reality, how different kinds of prices move, how risk is measured, and how money is made and lost.” To do this he proposed that “Finance must abandon its bad habits and adopt a scientific method.” He cited Extreme Value Theory, which assumes prices vary wildly and fat-tails as being on the right track.
Mandelbrot’s book, The Misbehavior of Markets: A Fractal View of Financial Turbulence, successfully challenged the credibility of modern finance tenets including modern portfolio theory, the efficient market hypothesis and the capital asset pricing model. These have been used to support market capitalisation investing. While Mandelbrot does not offer a silver bullet he does help investors better understand market volatility and thus be better prepared for periods of extreme risk.
Mandelbrot’s findings, it could be argued, support the use of different investment approaches beyond market capitalisation including smart beta and active tactical asset allocation. Good investors and advisers will have a range of tools in their belt to navigate the unpredictable volatility markets are sure to present. The only commonality between each rise and crash is that each has been different to every other one that has preceded it and if one fits into the ‘normal’ range it would be extraordinary.
IMPORTANT NOTICE: This information is issued by VanEck Investments Limited ABN 22 146 596 116 AFSL 416755 (‘VanEck) as the responsible entity and issuer of the VanEck Vectors Australian domiciled exchange traded funds (‘Funds’). Nothing in this content is a solicitation to buy or an offer to sell shares of any investment in any jurisdiction including where the offer or solicitation would be unlawful under the securities laws of such jurisdiction. This is general information only about financial products and not personal financial advice. It does not take into account any person’s individual objectives, financial situation or needs. Before making an investment decision in relation to a Fund, you should read the applicable PDS and with the assistance of a financial adviser consider if it is appropriate for your circumstances. PDSs are available at www.vaneck.com.au or by calling 1300 68 38 37. The Funds are subject to investment risk, including possible loss of capital invested. Past performance is not a reliable indicator of future performance. No member of the VanEck group of companies gives any guarantee or assurance as to the repayment of capital, the payment of income, the performance, or any particular rate of return from any Fund.
1Bryce James, 2017, Revisiting Modern Portfolio Theory, Investments & Wealth Monitor


Published: 14 March 2019