Value on the rise
VanEck Vectors Morningstar Wide Moat ETF (MOAT) has seen meaningful outperformance for the past few months, largely driven by the rotation from growth to more cyclical and value-oriented stocks.
In particular, the top three overweight sectors in MOAT are Financials (+0.57%), Industrials (+0.51%) and Consumer Staples (+0.40%), which generated the highest contribution to return for the month of March. On the individual stock front, Boeing (overweight; +0.33%), Altria Group (overweight; +0.30%) and Apple (underweight; +0.21%) topped the chart.
Performance of MOAT at 31 March
|
|
1 Mth |
3 Mths |
6 Mths |
1 Yr |
3 Yrs |
5 Yrs |
Since fund inception |
|
(%) |
(%) |
(%) |
(%) |
(% p.a.) |
(% p.a.) |
(% p.a.) |
|
|
MOAT |
7.62 |
13.07 |
20.66 |
28.39 |
20.57 |
19.34 |
20.25 |
|
S&P 500 |
6.06 |
7.44 |
11.79 |
25.00 |
16.39 |
15.84 |
18.2 |
|
Excess return |
+1.56 |
+5.63 |
+8.87 |
+3.39 |
+4.18 |
+3.5 |
+2.05 |
* Inception date is 24 April 2012.
Source: Morningstar Direct, VanEck. Results are calculated to the last business day of the month and assume immediate reinvestment of distributions. MOAT results are net of management costs and expenses, but before brokerage fees or bid/ask spreads incurred when investors buy/sell on the ASX. Past performance is not a reliable indicator of future performance. See fact sheet - here for up to date performance.
Contribution to Return One Month ending 31 March 2021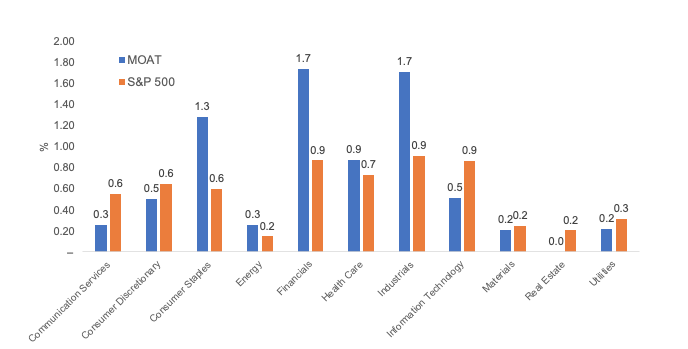
Source: FactSet as at 31 March 2021. Past performance is not a reliable indicator of future performance.
MOAT portfolio was rebalanced in March – it has seen rotation out of Financials (-6.8%) to Utilities (+1.2%), Industrials (+2.3%) and Healthcare (+3.2%). Tech exposure is still underweight 8.7% against S&P 500; the allocation is shifted from chip companies (Microchip Technology and Applied Materials) to software companies (Google and Facebook).
MOAT has a Value proposition – Value exposure is the largest weighting in the portfolio followed by Core and Growth. Instead of investing in Value as a factor, MOAT’s Morningstar research team focuses on valuations against fair value estimates. Companies that are attractively priced and that own sustainable comparative advantages are more likely to deliver good long-term performance.
|
Value |
44.4% |
+3.0% |
|
Core |
35.7% |
-6.8% |
|
Growth |
20.0% |
+3.7% |
Source: Morningtstar
Source: Morningstar Direct, as at 31 March 2021


Published: 16 April 2021
VanEck Investments Limited ACN 146 596 116 AFSL 416755 (‘VanEck’) is the responsible entity and issuer of units in VanEck Vectors Morningstar Wide Moat ETF (MOAT). This is general advice only, not personal financial advice. It does not take into account any person’s individual objectives, financial situation or needs. Read the PDS and speak with a financial adviser to determine if the fund is appropriate for your circumstances. The PDS is available here. An investment in MOAT carries risks associated with: financial markets generally, individual company management, industry sectors, ASX trading time differences, foreign currency, country or sector concentration, political, regulatory and tax risks, fund operations and tracking an index. See the PDS for details. No member of the VanEck group of companies guarantees the repayment of capital, the payment of income, performance, or any particular rate of return from any fund.
The Morningstar® Wide Moat Focus Index™ was created and is maintained by Morningstar, Inc. Morningstar, Inc. does not sponsor, endorse, issue, sell, or promote the Fund and bears no liability with respect to the Fund or any security. Morningstar®, Morningstar Wide Moat Focus Index™, and Economic Moat™ are trademarks of Morningstar, Inc. and have been licensed for use by VanEck.
Effective June 20, 2016, Morningstar implemented several changes to the Morningstar® Wide Moat Focus Index™ construction rules. Among other changes, the index increased its constituent count from 20 stocks to at least 40 stocks and modified its rebalance and reconstitution methodology. These changes may result in more diversified exposure, lower turnover and longer holding periods for index constituents than under the rules in effect prior to this date.
Related Insights