Earnings season for China A-shares
Earnings season is well underway for Chinese companies. As of close on 15 July 2021, 38% of A-share companies have released their pre-announcement. Out of 1,600 disclosed companies 69% are reporting positive 1H21 guidance.
Earnings season is well underway for Chinese companies. As of close on 15 July 2021, 38% of A-share companies have released their pre-announcement. Out of 1,600 disclosed companies 69% are reporting positive 1H21 guidance.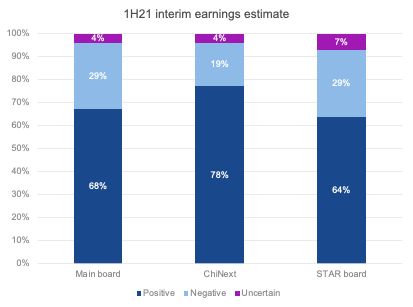
Source: CITIC
The market has been responding well to the earnings signals for the past few earnings cycles. The graph below illustrates the earnings estimate revision breadth, that is, the difference between the number of upward revisions and downward revisions as a percentage of total number of consensus estimates.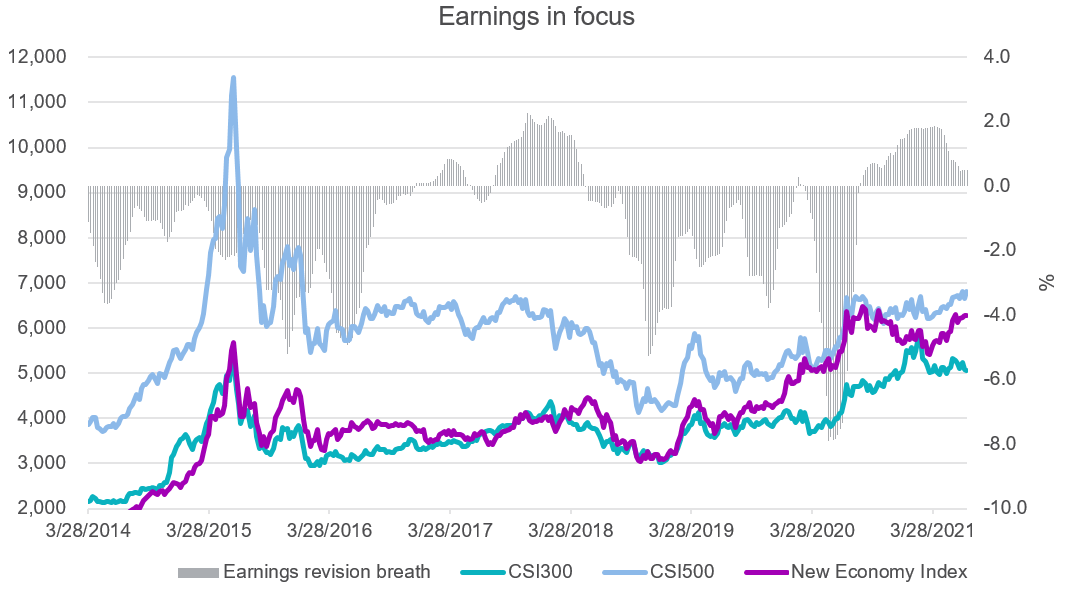
Source: Morgan Stanley, Bloomberg as of 9 July 2021. Earnings revision breadth is by 3-month moving average. New Economy Index is the CSI MarketGrader China New Economy Index.
Looking forward, companies with strong earnings expectations could also outperform in 2H21; investors are likely will switch focus from valuation to earnings and fundamentals. Sector wise, industrial and technology, media and telecom (TMT) are leading the pack with cumulative profit growth of 139% and 132% respectively this fiscal year, followed by consumer staples/discretionary at 110% and healthcare at 91%.
As earnings continue to be released, we’ve identified two sectors where the profit/growth might not be fully priced in:
- Healthcare – increasing R&D expenditure in pharma. Morgan Stanley estimates that Chinese pharma will have 16.4% CAGR from 2019-2024, significantly higher than its global peers at 4%.
- Technology – the increasing adoption of cloud computing. Investment in cloud vendors in the business-to-business field could accelerate the ‘cloudification’ process and the penetration of cloud computing in the enterprise market, resulting in improved long-term profitability for SME cloud vendors.
RRR cut
Effective from 15 July, a reserve requirement ratio (RRR) cut of 50bps for all banks is poised to release around 1 trillion yuan ($154.43 billion). This means that banks are allowed to hold less deposits as reserves and to provide liquidity to businesses and individuals. China’s central bank PBoC reiterates its monetary policy will remain prudent after the cut. The dovish stance might boost positive sentiment in the local equity market in 2H21.
Since 2018 there has been 10 RRR cuts, half being broad-based and half targeted. Historically the China A-share market has generally responded more positively to broad based cuts. This can be seen in the chart below which shows the performance of a range of Chinese equities indices and the response to broad based cuts (shown as solid lines) and the targeted measures (shown as dotted lines).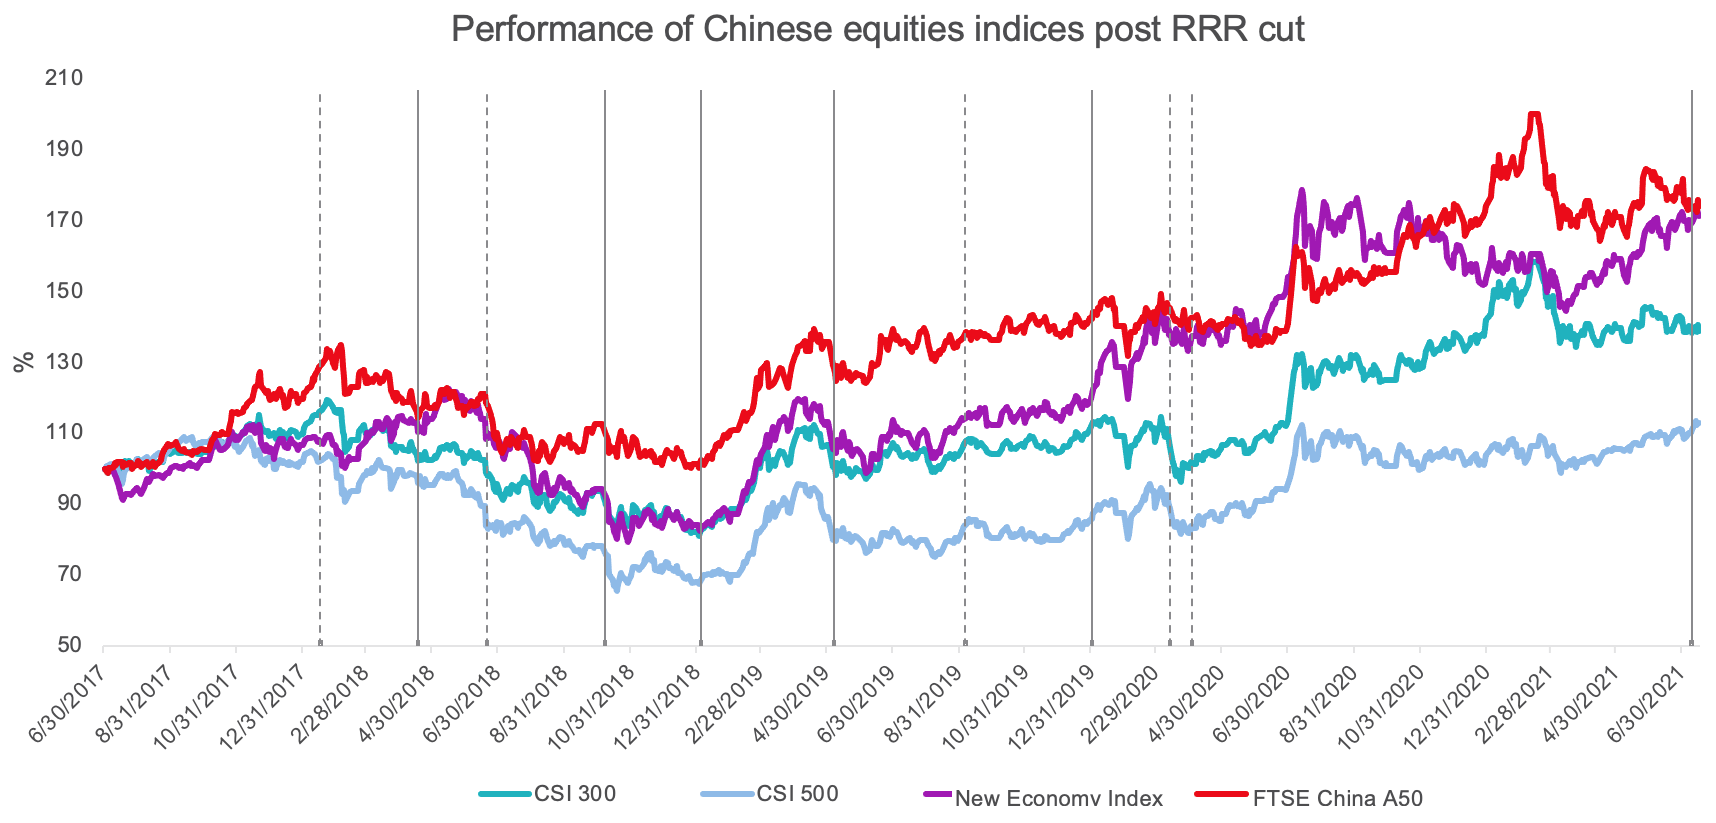
Source: Bloomberg as of 19 July 2021. New Economy Index is the CSI MarketGrader China New Economy Index.
The following table shows the performance of these indices six months since a rate cut announcement. In particular, the New Economy Index has reacted most positively in both categories among peers. It indicates that small and medium-sized enterprises (SMEs) are the major beneficiaries from a rate cut, as the New Economy Index portfolio has a small-cap bias. The data also suggests that from a shorter term perspective (1 day, 5 days and 1 month after the announcement) total average returns are within +/- 2% for all indices.
|
RRR cut announcement date |
Category |
CSI300 |
CSI500 |
New Economy Index |
FTSE China A50 Index |
|
17/01/2018 |
Targeted |
-18.8% |
-17.1% |
1.7% |
-17.3% |
|
17/04/2018 |
Broad |
-16.8% |
-29.8% |
-25.5% |
-7.6% |
|
20/06/2018 |
Targeted |
-15.6% |
-18.1% |
-23.4% |
-13.8% |
|
4/01/2019 |
Broad |
27.6% |
19.3% |
32.1% |
32.9% |
|
7/05/2019 |
Targeted |
7.3% |
0.7% |
9.6% |
10.8% |
|
6/09/2019 |
Broad |
4.8% |
11.8% |
25.6% |
5.8% |
|
1/01/2020 |
Broad |
3.7% |
11.7% |
29.1% |
0.9% |
|
13/03/2020 |
Targeted |
18.8% |
15.7% |
16.9% |
5.1% |
|
3/04/2020 |
Targeted |
23.5% |
21.3% |
17.1% |
8.7% |
|
Total average |
3.8% |
1.7% |
9.2% |
2.8% |
|
|
Broad average |
|
4.8% |
3.2% |
15.3% |
8.0% |
|
Target average |
3.0% |
0.5% |
4.4% |
-1.3% |
Source: PBOC, Bloomberg as of 19 July 2021. 7 October 2018 broad-based RRR cut excluded as it falls on a week-long holiday. New Economy Index is the CSI MarketGrader China New Economy Index.
Published: 25 July 2021
An investment in CNEW carries risks associated with: China; financial markets generally, individual company management, industry sectors, ASX trading time differences, foreign currency, sector concentration, political, regulatory and tax risks, fund operations, liquidity and tracking an index. See the PDS for details. No member of the VanEck group of companies guarantees the repayment of capital, the payment of income, performance, or any particular rate of return from any fund.
An investment in CETF carries risks associated with: China; financial markets generally, individual company management, industry sectors, ASX trading time differences, foreign currency, sector concentration, political, regulatory and tax risks, fund operations, liquidity and tracking an index. See the PDS for details. No member of the VanEck group of companies guarantees the repayment of capital, the payment of income, performance, or any particular rate of return from any fund.
CNEW tracks the CSI MarketGrader China New Economy Index. “MarketGrader" and “CSI MarketGraderChina New Economy Index” are trademarks of MarketGrader.com Corporation. MarketGrader does not sponsor, endorse, sell or promote the Fund and makes no representation regarding the advisability of investing in the Fund. The inclusion of a particular security in the Index does not reflect in any way an opinion of MarketGrader or its affiliates with respect to the investment merits of such security.
CETF is not in any way sponsored, endorsed, sold or promoted by FTSE International Limited or the London Stock Exchange Group companies (‘LSEG’) (together the ‘Licensor Parties’) and none of the Licensor Parties make any claim, prediction, warranty or representation whatsoever, expressly or impliedly, either as to (i) the results to be obtained from the use of the FTSE China A50 Index (‘Index’) upon which the VanEck FTSE China A50 ETF (“the Fund”) is based, (ii) the figure at which the Index is said to stand at any particular time on any particular day or otherwise, or (iii) the suitability of the Index for the purpose to which it is being put in connection with the Fund. None of the Licensor Parties have provided or will provide any financial or investment advice or recommendation in relation to the Index to VanEck or to its clients. The Index is calculated by FTSE or its agent. None of the Licensor Parties shall be (a) liable (whether in negligence or otherwise) to any person for any error in the Index or (b) under any obligation to advise any person of any error therein. All rights in the Index vest in FTSE. “FTSE®” is a trademark of LSEG and is used by FTSE and VanEck under license.