China’s new economy and the value of onshore stock selection
We have described the paradox in the Chinese equities market before. Chinese equities have simply failed to translate the country’s economic growth into shareholder returns. This has caused many growth-minded global investors to skip an allocation to Chinese equities altogether.
We have described the paradox in the Chinese equities market before. Despite China’s equity market having more than doubled in size in the last decade to become the second largest in the world by market capitalization (when the Shanghai and Shenzhen markets are combined), investors owning the broad market have failed to earn any return after inflation[1]. Chinese equities have simply failed to translate the country’s economic growth into shareholder returns. This has caused many growth-minded global investors to skip an allocation to Chinese equities altogether.
A deeper dive into the Chinese economy reveals that China’s market has largely bifurcated into what many now refer to as ‘old’ and ‘new economy’ stocks, with the former category including financials, energy, materials, industrials and utilities and the latter including the consumer, health care and technology sectors. In short, while the performance of the old economy may be stagnating in terms of stocks returns, the new economy companies are growing. Therefore, investors exposed to both Australian and US equities needn’t settle for paltry returns in order to diversify their portfolios. They can partake in both—returns and risk-reduction potential.
The MarketGrader China New Economy Index (MGCNE), tracked by the VanEck China New Economy ETF in Australia since 2018, is a benchmark of Chinese new economy companies with strong fundamentals based on MarketGrader’s GARP selection process. As of the publication of this blog, MGCNE has had an annualised return of 13.7% (in AUD) since its inception on December 31, 2007 – outperforming both the S&P/ASX 200 and the S&P 500. However, the better news is that MGCNE has had a correlation of only 0.08 to the ASX 200, 0.18 to the S&P 500 and 0.15 to the MSCI EAFE Index, meaning that it provided all of the diversification benefits without sacrificing the upside.
|
Index |
3 Years |
5 Years |
10 Years |
Since Inception |
|
S&P/ASX 200 Index |
11.9% |
10.9% |
10.0% |
5.5% |
|
S&P 500 Index |
19.1% |
19.2% |
20.3% |
12.1% |
|
MSCI EAFE Index |
9.9% |
10.6% |
11.7% |
4.8% |
|
MSCI EM Index |
10.5% |
10.1% |
8.9% |
4.0% |
|
MSCI China Index |
9.5% |
10.7% |
11.5% |
4.3% |
|
MSCI China A Onshore Index |
22.7% |
9.3% |
10.8% |
2.9% |
|
MarketGrader China New Economy Index |
24.6% |
9.0% |
16.6% |
13.7% |
Figure 1b. Correlations Matrix for Select Benchmark Returns Between 2008 and 2021
|
|
S&P/ASX 200 |
S&P |
MSCI EAFE |
MSCI EM |
MSCI China |
MG CNE |
MSCI China A |
|
ASX 200 Index |
1.00 |
0.49 |
0.65 |
0.66 |
0.37 |
0.08 |
0.18 |
|
S&P 500 Index |
1.00 |
0.78 |
0.44 |
0.28 |
0.18 |
0.25 |
|
|
MSCI EAFE Index |
1.00 |
0.65 |
0.42 |
0.15 |
0.23 |
||
|
MSCI EM Index |
1.00 |
0.76 |
0.27 |
0.41 |
|||
|
MSCI China Index |
1.00 |
0.46 |
0.61 |
||||
|
MG China New Economy Index |
1.00 |
0.80 |
|||||
|
MSCI China A Onshore Index |
1.00 |
Figure 2. Three-Year Rolling Correlations with the ASX 200 Index for Select Benchmarks
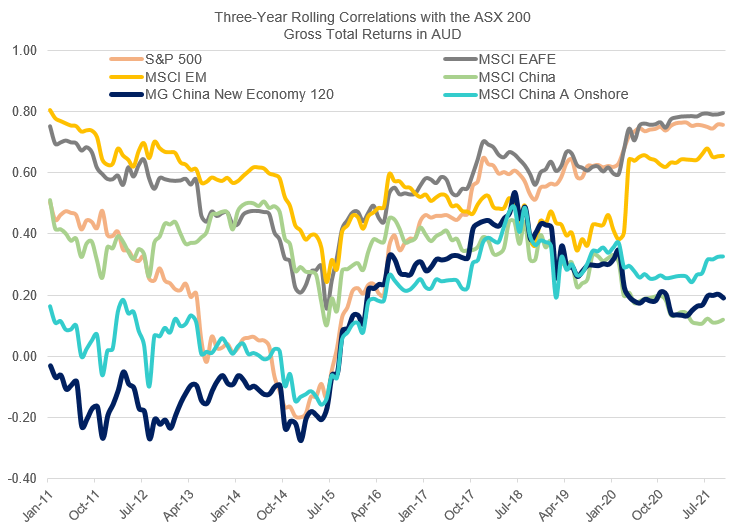
Source: MarketGrader, Data to 31 October 2021. Past performance is not a reliable indicator of future performance.
As an illustration of these twin benefits consider Figure 3. It presents two portfolios comprised of two asset classes – Australian equities and Chinese equities as benchmarked by the ASX 200 and MGCNE, respectively. Portfolio 1 allocates 25% to MGCNE and 75% to the ASX 200, while Portfolio 2 is an equal mix of both. The portfolios are assumed to be rebalanced to the normal weights annually. Starting in January 2008, through October 2021, a portfolio allocated 100% to the ASX 200 gained 109.1% on a cumulative total return basis. This translates into an annualized return of 5.5% over the period of 13 years and 10 months. Portfolio 1, with an allocation of 25% to MGCNE, would have gained 194.8% over the same period, which translates into an annualized return of 8.1%. Portfolio 2, with an equal allocation to the ASX 200 and MGCNE, would have returned 290.7%, or 10.4% annualized over the same period
|
Calendar Year Returns |
MG China New Economy |
S&P ASX 200 |
|
Mix 25/75 |
Mix 50/50 |
|
2008 |
-31.4% |
-38.4% |
|
-36.7% |
-35% |
|
2009 |
80.3% |
37.0% |
|
47.9% |
59% |
|
2010 |
19.8% |
1.6% |
|
6.1% |
11% |
|
2011 |
-22.6% |
-10.5% |
|
-13.5% |
-17% |
|
2012 |
6.2% |
20.3% |
|
16.8% |
13% |
|
2013 |
58.1% |
20.2% |
|
29.7% |
39% |
|
2014 |
25.9% |
5.6% |
|
10.7% |
16% |
|
2015 |
88.4% |
2.6% |
|
24.0% |
46% |
|
2016 |
-19.1% |
11.8% |
|
4.1% |
-4% |
|
2017 |
7.1% |
11.8% |
|
10.6% |
9% |
|
2018 |
-20.7% |
-2.8% |
|
-7.3% |
-12% |
|
2019 |
41.2% |
23.4% |
|
27.8% |
32% |
|
2020 |
28.2% |
1.4% |
|
8.1% |
15% |
|
2021 (ending October) |
3.8% |
14.7% |
|
12.0% |
9% |
|
Cumulative |
490.0% |
109.1% |
|
194.8% |
290.7% |
[1] Based on China’s stock market growth between 2009 and 2019 and on annualised returns for the CSI All Share
Index. Source: The Chinese Equity Market Paradox, MarketGrader 2020.


Published: 22 November 2021
VanEck Investments Limited ACN 146 596 116 AFSL 416755 (‘VanEck’) is the responsible entity and issuer of units in the VanEck China New Economy ETF (CNEW). This is general advice only, not personal financial advice. It does not take into account any person’s individual objectives, financial situation or needs. Read the PDS and speak with a financial adviser to determine if the fund is appropriate for your circumstances. The PDS is available here. The Target Market Determination is available here.
CNEW tracks the MarketGrader China New Economy Index. "MarketGrader" And “MarketGrader China New Economy Index” are trademarks of MarketGrader.com Corporation. MarketGrader does not sponsor, endorse, sell or promote the Fund and makes no representation regarding the advisability of investing in the Fund. The inclusion of a particular security in the Index does not reflect in any way an opinion of MarketGrader or its affiliates with respect to the investment merits of such security.
An investment in CNEW carries risks associated with: China; financial markets generally, individual company management, industry sectors, ASX trading time differences, foreign currency, sector concentration, political, regulatory and tax risks, fund operations, liquidity and tracking an index. See the PDS for details. No member of the VanEck group of companies guarantees the repayment of capital, the payment of income, performance, or any particular rate of return from any fund.