Balancing ESG exposure and valuations
Environmental, Social, and Governance (ESG) ETF use has exploded over the last few years in Australia, with total assets under management (AUM) surpassing $1.5bn in April 2021. While investors typically focus on ESG screens as the criteria for investment selection, in the current economic environment it is now more important than ever to also consider valuations and sector exposure.
Environmental, Social, and Governance (ESG) ETF use has exploded over the last few years in Australia, with total assets under management (AUM) surpassing $1.5bn in April 2021. While investors typically focus on ESG screens as the criteria for investment selection, in the current economic environment it is now more important than ever to also consider valuations and sector exposure.
Macroeconomic shift – inflation environment
Investors that have been overweight technology/growth stocks since the global financial crisis have performed well, amid a backdrop of falling interest rates, boosting valuations (Chart 1). However, in recent months, murmurs of inflation talk have dominated media headlines. Global commodities prices, most notably iron ore prices have skyrocketed, surpassing $200 a tonne USD for the first time (Chart 2). Commodity prices are widely considered a leading indicator for inflation (Chart 3).
Chart 1 – Cumulative performance of MSCI World Growth relative to value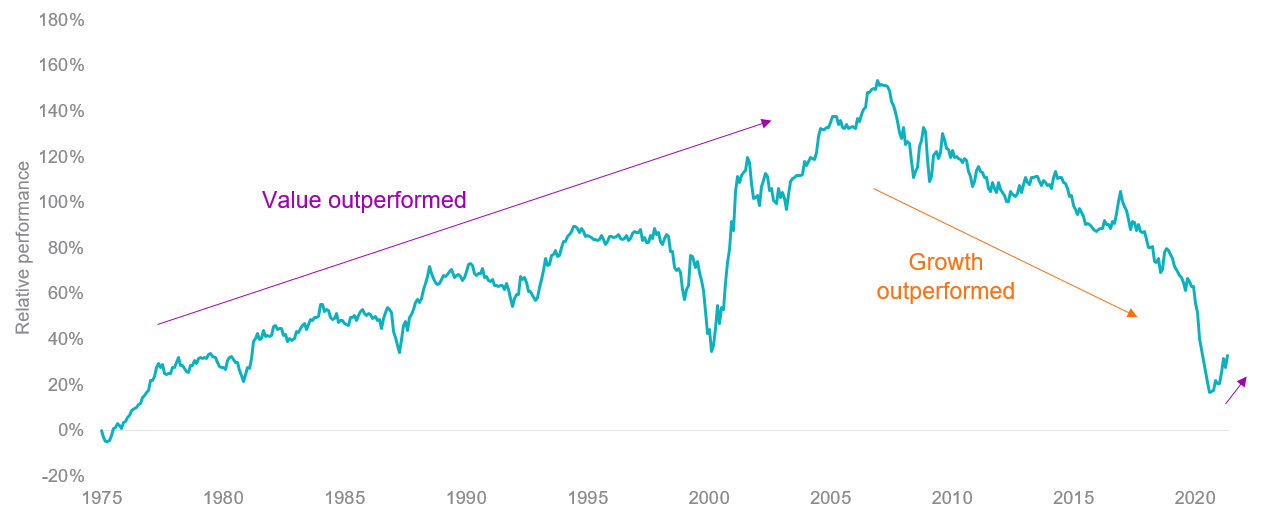
Source: Bloomberg. Indices used MSCI World Growth Index and MSCI World Value Index.
Chart 2 & 3 – Iron Ore Spot price Index 62% Import Fine Ore CFR Qingdao | US CPI versus commodity spot prices
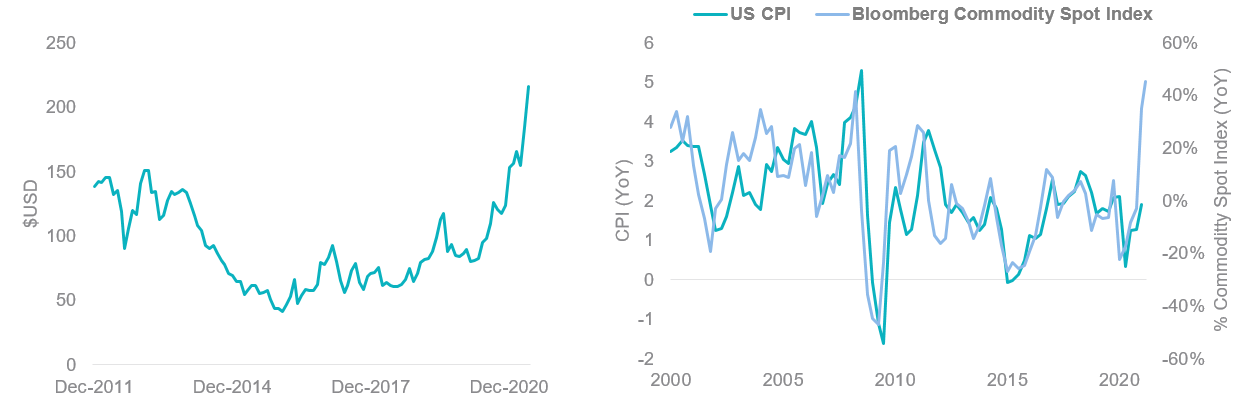
Source: Bloomberg
If inflation does return, this could spark a dramatic sell-off in high growth/technology assets. You can read more about the potential impact of inflation on investments here. Value stocks have outperformed growth stocks over the last 6 months as shown above. Traditional value sectors include financials, energy, utilities and industrials.
Looking under the hood
To illustrate the potential differences in risk and opportunity, below is a comparison of two ASX listed international ESG ETFs by valuations and sector exposure relative to the benchmark.
- ETF 1 tracks the MSCI World ex Australia ex Fossil Fuel Select SRI and Low Carbon Capped Index
- ETF 2 tracks the Nasdaq Future Global Sustainability Leaders Index
ETF 1 is overweight value sectors financials and industrials and ETF 2 is overweight technology.
Chart 4 – Sector exposure comparison relative to MSCI World ex Australia
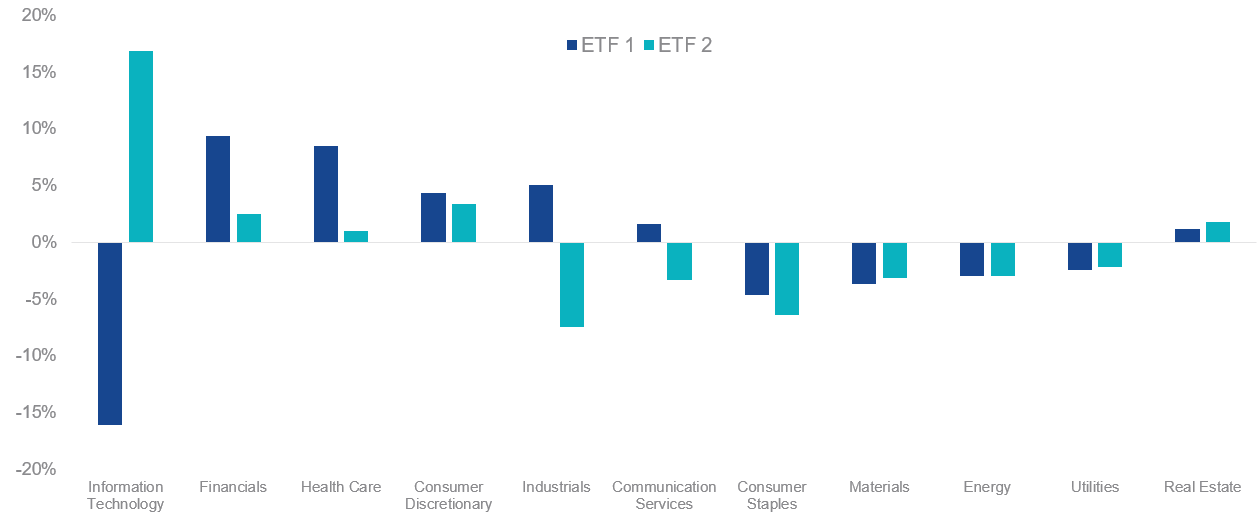
Source: Bloomberg. As at 30 April 2021
ETF 1 price to earnings is the lowest and return on equity (ROE) is the highest relative to MSCI World ex Australia and ETF 2.
Chart 5 – Valuations comparison relative to MSCI World ex Australia
|
Metric |
MSCI World ex Australia |
ETF 1 |
ETF 2 |
|
ROE |
18.4 |
20.6 |
9.6 |
|
LT Debt to Capital |
40.6 |
35.7 |
30.6 |
|
Hist 3Yr EPS Growth |
16.3 |
10.9 |
1.2 |
|
Price to Earnings |
24.4 |
22.2 |
28.5 |
Source: Factset, As at 30 April 2021
VanEck’s MSCI International Sustainable Equity ETF (ASX code: ESGI) tracks the MSCI World ex Australia ex Fossil Fuel Select SRI and Low Carbon Capped Index. Learn more about ESGI here.


Published: 30 May 2021
IMPORTANT INFORMATION
An investment in ESGI carries risks associated with: financial markets generally, individual company management, industry sectors, ASX trading time differences, foreign currency, country or sector concentration, political, regulatory and tax risks, fund operations and tracking an index. See the PDS for details. No member of the VanEck group of companies guarantees the repayment of capital, the payment of income, performance, or any particular rate of return from any fund.
ESGI is indexed to a MSCI index. ESGI is not sponsored, endorsed or promoted by MSCI, and MSCI bears no liability with respect to ESGI or the MSCI Index. The PDS contains a more detailed description of the limited relationship MSCI has with VanEck and ESGI.