A-REITs: a year on from their peak
In what now seems a distant memory, A-REITs were rallying at the start of 2020 reaching a peak on 20 February 2020, up by 9.1% from the beginning of 2020. A year on it’s worth reflecting what has happened in that time.
In what now seems distant memory Australian Real Estate Investment Trusts (A-REITs) were rallying at the start of 2020 reaching a peak on 20 February 2020, up by 9.1% from the beginning of 2020. These gains quickly turned to large losses as COVID-19 spread around the world. Markets hit a low in mid- to late-March, with A-REITs down 50% from their February peak.
During the subsequent recovery A-REITS did not rebound as quickly as the rest of the equities market. Figure 1 below compares the performance of A-REITs as measured by the MVIS Australia A-REITs Index compared to the S&P/ASX 200 since 20 February 2020 to 16 March 2021. The total return for the S&P/ASX 200 is relatively flat with -1.13% return for the period, whereas AREITs are down by 16.10%.
Figure 1: A-REITs have underperformed the broader equity market last year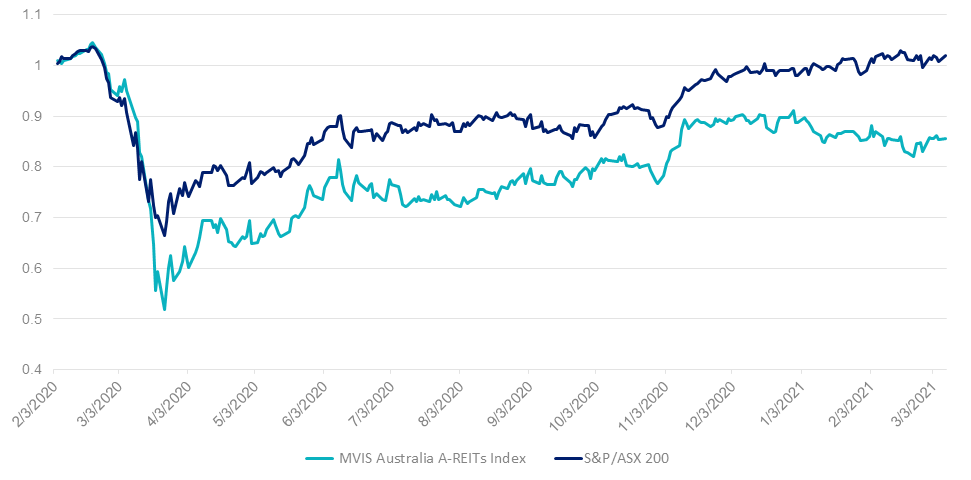
Source: Bloomberg, as at 16 March 2021. The above chart is a comparison of performance of the MVIS Australia A-REITs Index and S&P/ASX 200 Accumulation Index. Results are calculated to the last business day of the month and assume immediate reinvestment of all dividends and exclude costs associated with investing.
You cannot invest directly in an index. Past performance is not a reliable indicator of future performance of the indices.
Within A-REITs there is a wide variance between the performances of different A-REIT sub-sectors. This has also played during the market’s reaction to the announcement of COVID-19 vaccines. You can see in figure 2 below, retail REITs, including Scentre Group (SCG) rebounded 38.05% since the announcement of the vaccine. This was after a fall of 41.0% from 20 February 2020 to 30 September 2020 .Out of the fifteen REITs in figure 2 the only one to achieve a positive return for the entire period was Goodman Group (GMG), which has a large exposure to industrial properties. These performed well over the past year due to the growth of e-commerce.
Figure 2: A-REIT performance during the COVID recovery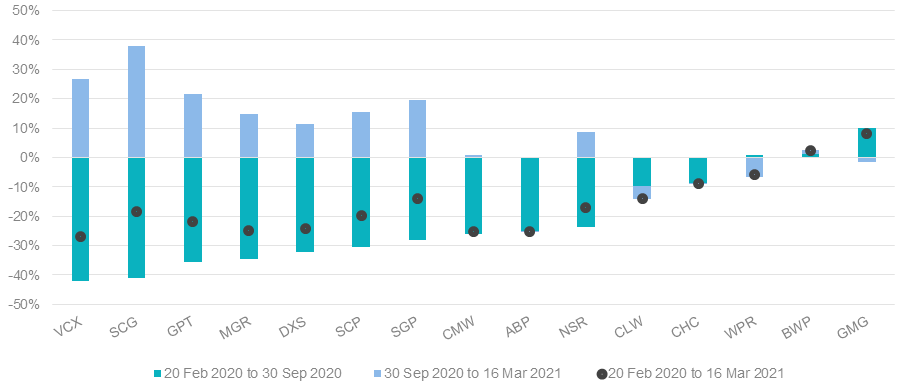
Source: Bloomberg, as at 16 March 2021. Past performance is not a reliable indicator of future performance.
Moving into 2021 the recovery in A-REITs has stalled due to increasing bond rates. The Australian Government ten-year bond yield has increased approximately 1% to 1.78% from the beginning of the year 18 March 2021. This is bad for A-REITs as it suggests that borrowing costs will rise however A-REITs have survived crises many times in the past. A-REITs are still paying a yield that is more attractive than other income assets, they have less debt than in previous recoveries and many A-REITs are yet to recover back to their pre-COVID-19 highs.
Sub-sector outlook
The Retail REIT sector, including shopping malls, currently has occupancy percentage rates in the high 90’s. Their performance going forward will depend on the number of retail bankruptcies and the extent to which e-commerce rates are retained or increase post the pandemic. Overall we do not expect rents to return to their pre pandemic levels.
On the other hand the continued strong performance of industrial companies will be dependent on the continued strong growth of e-commerce.
Companies that occupy premises in the CBD are re-evaluating their real estate needs too. Although many workers are returning to their offices we expect there will be a shift in which a portion of the workforce will continue to work from home on a part time basis. As a result, we expect office rents to remain subdued for some time.
On the residential front the unprecedented stimulus including the Home Builder grant is driving the market. With no planned changes to lending criteria and/or the capital requirements on banks’ lending it is expected that residential property will continue to grow.


Published: 18 March 2021
MVIS Australia A-REITs Index (‘MVIS Index’) is the exclusive property of MV Index Solutions GmbH based in Frankfurt, Germany (‘MVIS’). MVIS is a related entity of VanEck. MVIS makes no representation regarding the advisability of investing in the Fund. MVIS has contracted with Solactive AG to maintain and calculate the MVIS Index. Solactive uses its best efforts to ensure that the MVIS Index is calculated correctly. Irrespective of its obligations towards MVIS, Solactive has no obligation to point out errors in the MVIS Index to third parties.