Last week Nike shares hit an all-time high after the company announced its results. Nike’s earnings beat analysts’ forecasts as the company has experienced growth from new products and investments in e-commerce. Since the beginning of the year Nike’s share price has increased from US$74.06 to just over US$93.92, its return on equity (ROE) is a healthy ~42.7%, it has strong earnings and revenue growth and a healthy balance sheet – Nike is a quality company.

Last week Nike shares hit an all-time high after the company announced its results. Nike’s earnings beat analysts’ forecasts as the company has experienced growth from new products and investments in e-commerce. Since the beginning of the year Nike’s share price has increased from US$74.06 to just over US$93.92, its return on equity (ROE) is a healthy ~42.7%, it has strong earnings and revenue growth and a healthy balance sheet – Nike is a quality company.
Nike, the largest athletic footwear brand in the world thrives through the ‘noise‘ of controversy
Last year Nike made headlines around the world for its controversial ad campaign featuring former NFL quarterback Colin Kaepernick. Kaepernick was a controversial choice because he had sparked the ire of many Americans, including President Trump, for kneeling during the National Anthem to protest police brutality against African Americans. Immediately Nike’s share price fell.
Last week, in a reminder that its worthwhile investors look past the short term, Nike’s share price surged over 5% after the company smashed expectations on its earnings. The stock is up over 20% since the beginning of the year and has outperformed the S&P 500 by over 10% since the launch of the Kaepernick ad.
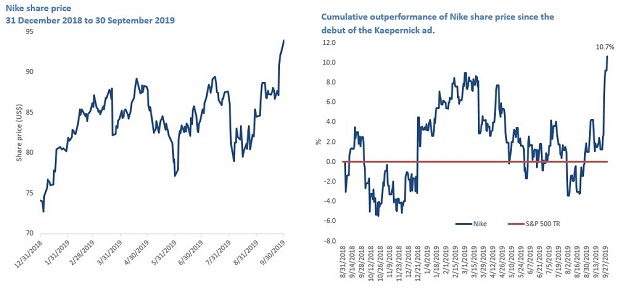
Source: Bloomberg, Kaepernick. Past performance is not a reliable indicator of future performance. For LHS, Kaepernick ad debuted 1 September 2018.
Looking at Nike’s characteristics over a longer time period, Nike has developed into a ‘quality’ company:
- Revenue has more than doubled in the past 11 years and has increased in 10 of the past 11 years. This consistent earnings is an attribute of a quality company.
- Nike is in excellent financial shape. In its last results, Nike had $3.5 billion in long-term debt and $4.5 billion in cash and short term investments. Nike’s debt to equity is a low 0.4. Low debt is another attribute of a quality company.
- Return on equity is currently 42.7%.
As a result of these characteristics, Nike is in QUAL. It has been in the fund since QUAL launched in 2014
Quality companies have outperformed in low growth environments
One of the reasons many investors have been wary of consumer discretionary companies like Nike is that these companies tend to suffer in the event of an economic slowdown. There are many market commentators predicting a US and global economic slowdown because:
- sustained low interest rates;
- slowing global demand; and
- falling consumer price levels and falling capital expenditure in many countries.
Markets experiencing these types of conditions are typically growing slowly, if at all, and have low inflation. Investors in these environments are worried how to position their international equity portfolios and seeking investments that lose less and recover faster, a hallmark of quality.
MSCI, the world’s largest index provider, analysed more than 40 years of data to provide insight into the best periods of outperformance of the Quality factor. The results are summarised below:
Table 1 - Summary of bivariate analysis of MSCI quality and sector indices in economic cycles from December 1975 to December 2013
|
Economic conditions |
Quality factor performance |
Sector comments |
|
Rising Inflation / Rising Growth |
Moderate outperformance |
IT sector outperforming, financials and telecommunications underperforming |
|
Falling Inflation / Rising Growth |
Moderate Underperformance |
Energy and materials outperforming, healthcare and consumer sectors underperforming |
|
Falling Inflation / Slowing Growth |
Strong outperformance |
Health care and consumer staples outperform, materials, energy and industrial underperform |
|
Rising Inflation / Slowing Growth |
Strong outperformance |
Health care, energy and consumer staples outperform, consumer discretionary and materials underperform |
Source: VanEck, Gupta, Abhishek, Altaf Kassam, Raghu Surtanarayanan, Katalin Varga. 2014. “Index Performance in Changing Economic Environments.” MSCI Research Insight.
MSCI’s conclusion was that historically the Quality factor outperforms in three of the four economic stages that MSCI identified and it has demonstrated its best relative outperformance in economic conditions characterised by slowing growth and falling inflation. This is because, in such periods, investors seek the types of stocks, irrespective of sector, that Quality identifies such as Nike: higher return on equity (ROE), sustainable earnings and low financial leverage. Hence the term, ‘Flight to Quality.’
In times of a US recession; Quality, as represented by the index QUAL tracks - the MSCI World ex Australia Quality Index, would have outperformed.
As highlighted in the chart below, the Quality Index would have outperformed during the 2001 and 2007 US recessions
Excess return chart – QUAL Index 12 month rolling excess return versus MSCI World ex Australia Index
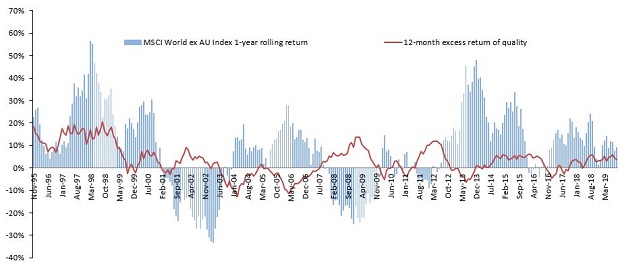
Source: VanEck, Bloomberg. Chart shows performance of MSCI World ex Australia Index rolling 12 month total return relative to MSCI World ex Australia Quality Index (QUAL Index) 12 month excess return. You cannot invest in an index. QUAL Index base date is 30 November 1994. QUAL Index performance prior to its launch on 20 October 2014 is simulated based on the current index methodology. QUAL Index returns do not include fees and costs of investing in QUAL. Past performance of QUAL Index is not a reliable indicator of future performance of QUAL.
VanEck Vectors MSCI World ex Australia Quality ETF (QUAL)
QUAL aims to provide returns before fees, costs and taxes that track the performance of the MSCI World ex Australia Quality Index by fully replicating the index at all times. QUAL does not make tactical cash allocations. It is a portfolio of 300 international stocks and includes only the highest quality scoring stocks determined by MSCI based on three easily identifiable financial characteristics:
- High Return on Equity (ROE);
- Stable year-on-year earnings growth; and
- Low financial leverage.
With a single trade on ASX you can use QUAL to invest in 300 quality international companies and since its inception it has consistently outperformed the broad market MSCI World ex Australia Index, after fees.
Find out more about QUAL here
IMPORTANT NOTICE: This information is issued by VanEck Investments Limited ABN 22 146 596 116 AFSL 416755 (‘VanEck’) as responsible entity and issuer of the VanEck Vectors MSCI World ex Australia Quality ETF and VanEck Vectors MSCI World ex Australia Quality (Hedged) ETF. This is general information about financial products only and not personal financial advice. It does not take into account any person’s individual objectives, financial situation or needs. Before making an investment decision in relation to an ETF, you should read the PDS and with the assistance of a financial adviser consider if it is appropriate for your circumstances. The PDS is available at www.vaneck.com.au or by calling 1300 68 38 37. The funds are subject to investment risk, including possible loss of capital invested. Past performance is not a reliable indicator of future performance. No member of the VanEck group of companies gives any guarantee or assurance as to the repayment of capital, the payment of income, the performance, or any particular rate of return from any ETF.
QUAL and QHAL invest in international markets. An investment in QUAL or QHAL has specific and heightened risks that are in addition to the typical risks associated with investing in the Australian market. These include currency risks from foreign exchange fluctuations, ASX trading time differences and changes in foreign laws and regulations including taxation.
QUAL and QHAL are indexed to a MSCI index. The ETFs are not sponsored, endorsed, or promoted by MSCI, and MSCI bears no liability with respect to QUAL or QHAL or the MSCI Index. The PDSs contain a more detailed description of the limited relationship MSCI has with VanEck and the ETFs.
Photo by Barrett Ward on Unsplash.

Published: 09 October 2019
Related Insights