Quality small caps
Australian investors are often attracted to Australian small companies because of their historical long term outperformance above large companies. A similar history of long-term outperformance also applies for international small-cap stocks. However, large and mid-sized companies from developed markets often dominate international investments in Australian investors’ portfolios and international small companies are often underrepresented. Historically, investing directly in international small-caps has proved difficult due to accessibility and cost. Here we provide some insightful analysis for our popular International Small Companies ETF (QSML), which launched this year, versus the international equity small companies benchmark.
Most Australian portfolios have an allocation to international equities, often via locally managed listed and unlisted funds. The benefits of including international equities in a portfolio have been well documented. International equities provide:
1. Better geographic diversification – the Australian stock market represents only 2% of global stock markets;
2. Better sector diversification – Australia is dominated by resources and financials with limited opportunities in technology and health care; and
3. Exposure to different economic cycles.
Often Australian investors’ exposures to international equities are dominated by large- and mid-cap companies. This is because the benchmark index used by Australian managers is the MSCI World ex Australia Index, which aims to capture the performance of these large- and mid-cap companies. This benchmark captures approximately 85% of the free float-adjusted market capitalisation of each developed country in the index, so it includes the largest companies in each country, until this threshold is reached.
As a result, investors are missing opportunities in the remaining 15% of the international equities market not included in the benchmark. These companies are international small-cap companies.
The rationale for considering international small-cap companies is compelling, potentially more so than Australian small-caps. Yet while Australian investors recognise the small-cap opportunity and are invested via the local small-cap market, because of limited opportunities and difficulty of access, it is likely an Australian investor’s international small-cap exposure does not echo their domestic exposure. To date there has only been two popular approaches to investing in international small companies:
- Via an actively managed fund; or
- Via a passive fund tracking the benchmark index.
When actively managed funds were first offered to investors, performance was uncertain and the costs were high. Sometimes the returns were good, but often they were not. Many people found this a poor bargain and moved to lower cost passive funds that tracked traditional indices. In these new funds, returns could be thought of as average - not high, not low, just the market average. When it comes to investing in an international small-cap passive fund, the widely used benchmark is the MSCI World ex Australia Small Companies Index, for ease of reading let’s call it the International Small Cap Index. Innovations in index design for passive funds are delivering above market benchmark returns over the long term while retaining low costs. It is this approach VanEck offers in international equities and it is being used by savvy investors as a substitute for both.
Many Australian investors would be aware of our international quality ETF, QUAL that tracks the MSCI World ex Australia Quality Index and it targets international companies with a high return on equity (ROE), low leverage and stable earnings. Earlier this year we launched the VanEck MSCI International Small Companies Quality ETF and it tracks the MSCI World ex Australia Small Cap Quality 150 Index. We affectionately call it “baby QUAL” because it harvests the Quality Factor, using the same fundamentals as QUAL, but in the International Small Cap universe.
We recently wrote a research paper “Finding the pawns that will become Queens” that raises the question: given many Australian portfolios have an allocation to Australian Small Caps, why not International Small Caps? When you consider the long-term risk and return trade-off, the case for international small companies is compelling. It also shows that the quality factor is more pronounced in international small companies than international large companies.
So let’s walk through the difference between the MSCI World ex Australia Small Cap Quality 150 Index (QSML Index) and the International Small Cap Index.
QSML vs International Small Cap Index – Fundamentals
|
|
QSML |
International Small Cap Index |
|
Index strategy |
Smart beta – quality |
Market capitalisation weight |
|
Number of countries |
15 |
25 |
|
Number of sectors |
9 |
11 |
|
Number of holdings |
148 |
4237 |
|
12mth trailing Dividend Yield |
1.4% |
1.8% |
|
Dividend frequency |
Annually |
|
|
Return on equity (ROE) (%) |
20.0 |
6.2 |
|
Financial leverage (debt to equity) (x) |
0.3 |
1.3 |
|
Earnings per share (EPS) growth rate (%) |
13.3 |
12.7 |
As you would expect, QSML has higher ROE, lower debt to equity and a higher EPS growth rate.
QSML Index vs International Small Cap Index - Performance
Based on back testing after fees, QSML’s Index (net of QSML’s 0.59% p.a. management fee) displays long-term outperformance against the MSCI World ex Australia Small Companies Index, both of which outperform the large capitalisation equivalent, as highlighted by the chart below.
Chart 1: Cumulative performance: QSML Index after fees1vs MSCI market capitalisation indices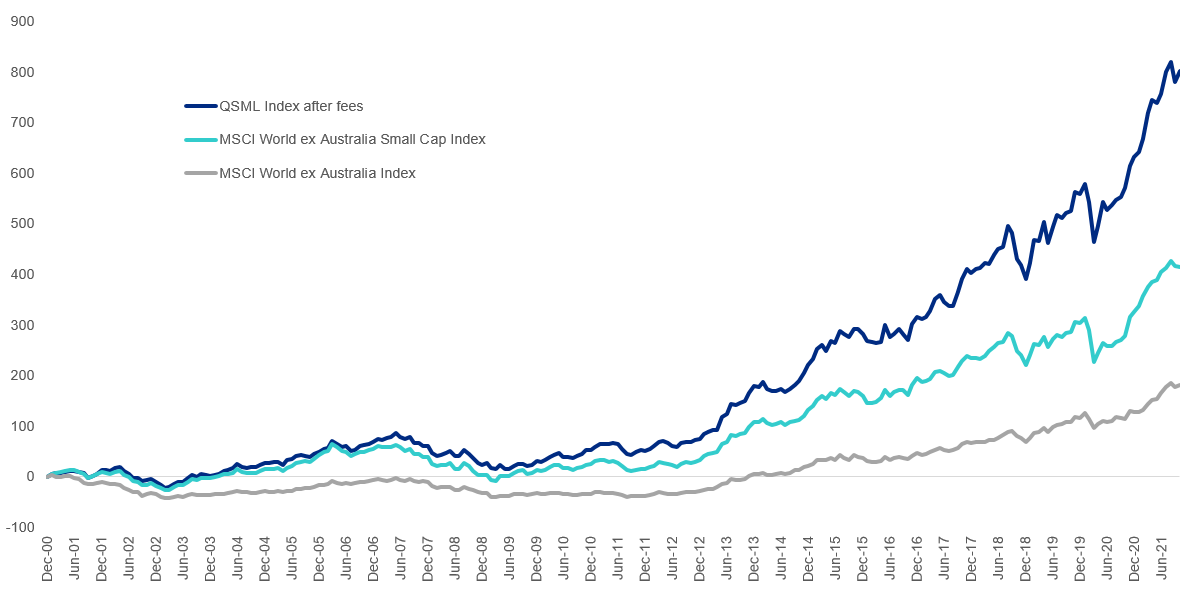
Table 2: Trailing returns: QSML, QSML Index after fees1 vs MSCI World ex Australia Small Companies Index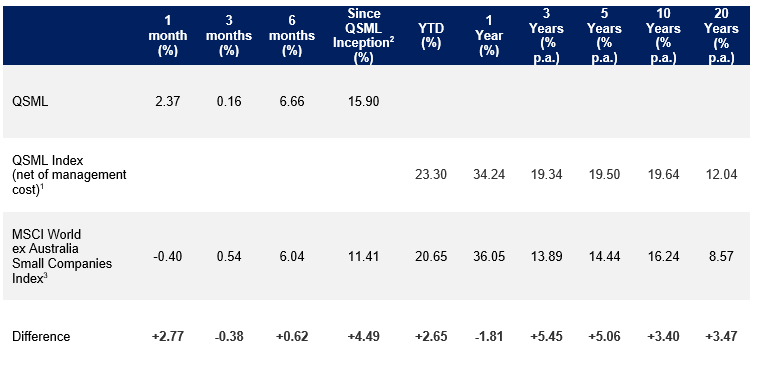
Chart 1 and Table 2 Source: VanEck, Morningstar, Bloomberg as at 31 October 2021. Past performance is not a reliable indicator of future performance.
1QSML Index results are net of QSML’s 0.59% p.a. management costs, calculated daily but do not include brokerage costs or buy/sell spreads of investing in QSML. You cannot invest in an index. QSML’s Index base date is 30 November 1998. QSML Index performance prior to its launch in February 2021 is simulated based on the current index methodology.
2QSML inception date is 8 March 2021 and a copy of the factsheet is here.
3The MSCI World ex Australia Small Companies Index (Parent Index) is shown for comparison purposes as it is the widely recognised benchmark used to measure the performance of developed market small companies, weighted by market cap. QSML Index measures the performance of 150 companies selected from the Parent Index based on MSCI quality scores. Consequently the QSML Index has fewer companies and different country and industry allocations than the Parent Index. ‘Click here for more details’.
QSML vs International Small Cap Index - Top 10 holdings
Below you can see the top 10 companies. As you would expect, in the International Small Companies Index, with over 4,000 the top 10 weights are small. The biggest holding is only 0.25% of the portfolio. The QSML Index’s holdings have a more meaningful exposure. Some of the names might be familiar to you, Williams Sonoma manufacture cookware while Toro is known for its garden equipment – to see all the holdings in QSML and their weightings click here.
Table 4: Top 10 holdings QSML Table 5: Top 10 MSCI World ex Australia Index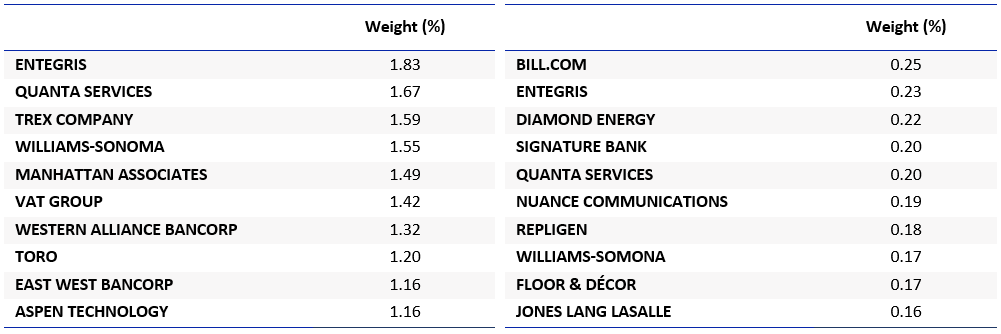
Source: Factset, VanEck, MSCI, as at 31 October 2021
QSML vs International Small Cap Index - Style
When looking at portfolios it is important to determine what style, e.g. value or growth and what size bias a portfolio holds, e.g. giant, large, mid or small. Below we can see QSML’s. Importantly QSML skews towards mid-sized companies and it has a greater growth bias than the International Small Cap Index.
Chart 2: QSML holdings based style map Chart 3: MSCI World ex Australia Small Companies
Index holdings based style map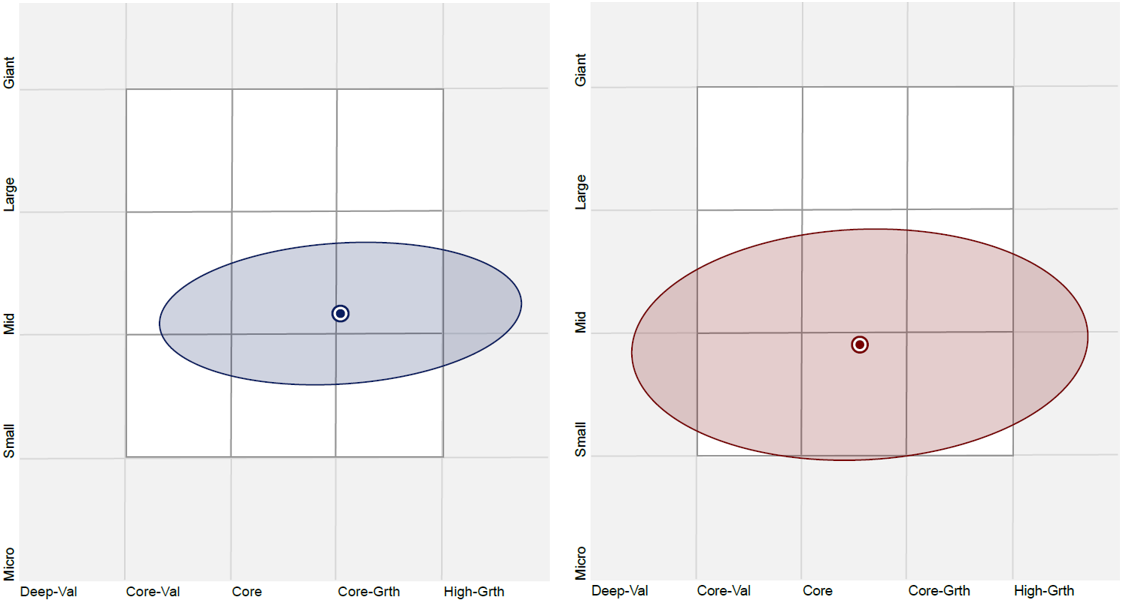
Source: Morningstar Direct, as at 31 October 2021
While each International Small Company ETF has its merit for portfolio inclusion, you should assess all the risks and consider your investment objectives.
Past performance is no guarantee of future performance. The above is not a recommendation. Please speak to your financial adviser or stock broker.
For further information you can contact us at +61 2 8038 3300.
Key risks
An investment in QSML carries risks associated with: ASX trading time differences, financial markets generally, individual company management, industry sectors, foreign currency, country or sector concentration, political, regulatory and tax risks, fund operations, liquidity and tracking an index. See the PDS for details. No member of the VanEck group of companies guarantees the repayment of capital, the payment of income, performance, or any particular rate of return from any fund.


Published: 12 November 2021
Related Insights