Gold’s growth strategy: green or brown, cash or stock?
Trade deal or no trade deal?
There was not much significant news flow to drive markets in November. As such, markets were fixated on whether or not a trade deal might happen between the US and China. Gold fell to US$1,445 per ounce at one point amid press reports of a “Phase 1” tariff deal. However, there was little movement in the US dollar or interest rates, and the stock market turned giddy once again, with the S&P 500 jumping to new all-time highs. Perhaps the stock market was also responding to the resumption of quantitative-easing-style stimulus, disguised as support for the overnight lending market. The gold price declined by US$48.99 (3.2%) to US$1,463.95. Gold stocks performed in-line with gold, as the NYSE Arca Gold Miners Index fell 2.04% and the MVIS Global Junior Gold Miners Index declined 0.98%.
Correction continues but warning signs are flashing
The gold price remains elevated above US$1,450 as it enters its fourth month of correction after reaching a six-year high of US$1,557 in early September. Global gold exchange traded products (ETPs) subsequently experienced their first significant outflows, though small inflows did resume in late November. It is difficult to see much market movement in the near term as the Fed’s rate outlook appears to be on hold, Brexit was postponed again, and global trade stagnates. Geopolitical risks continue to escalate with persistent protests in Hong Kong and Latin America. Brazen terrorist attacks have also gripped West Africa, while conflicts continue in the Middle East. Political unrest has yet to have a significant impact on global financial markets despite its increasing breadth and frequency. We believe late-cycle financial risks will increase. With no end in sight to the spread of geopolitical turmoil, we believe gold might see significant gains in the next year.
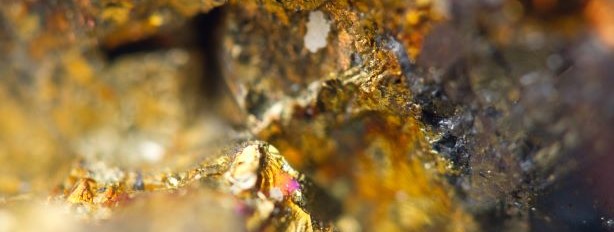
Growth strategy: from exploration to M&A
Based on S&P Global Markets’ estimates for 2019 exploration spending, Australia spent more in exploration than Canada and the US this year. Gold remains the leading metal with US$4.29 billion allocated towards exploration — down 12% from last year despite the jump in the gold price. As well, this is actually the first year that mine-site, or “brownfields”, budgets have accounted for the largest share of exploration spending, with past spending results typically dominated by new, or “greenfields”, exploration.
We believe this reflects the current strategy of many producers to focus on getting more from their existing assets to create value organically, rather than building in new areas. While this strategy works quite well, we think it has its limits and that companies will eventually need to increase their greenfields efforts or engage in mergers and acquisitions (M&A).
M&A activity has increased recently, with Zijin Mining, China’s largest listed producer of mined gold, announcing its acquisition of Toronto-based Continental Gold. The US$1.05 billion all-cash deal is valued at a 29% premium over Continental’s 20-day volume weighted average stock price. Continental is building Colombia’s first world-class underground gold operation, set to start production in 2020. In our opinion, Continental has done a good job of discovering and developing the Buritica Project. While Zijin is paying a hefty premium, our valuation indicates that if the company can navigate the recent political turmoil gripping Colombia and properly manage the start-up risks that all new mines face, they, too, may realise a generous return on their investment.
A closer look at the Kirkland-Detour deal
Separately, mid-tier producer Kirkland Lake Gold also announced a friendly acquisition of Detour Gold. The two combined have a market value of around US$12 billion. Kirkland company presentations estimate 2019 production of 960,000 ounces, mainly from two high-grade underground mines in Canada and Australia at all-in sustaining cost (AISC) of US$540 per ounce. Detour estimates 2019 production of 600,000 ounces from a large low-grade open pit in Canada at AISC of US$1,140 per ounce.
Both companies have done well. Kirkland’s share price is up 60% this year, while Detour is in the process of a turnaround under its new CEO, and its stock has re-rated.
The acquisition provides a third cornerstone asset for Kirkland. Kirkland also has the capital needed to advance exploration and, hopefully, increase Detour’s production by up to 50%.
While the strategy behind this acquisition makes sense, we are disappointed with the structure of the deal. This is an all-stock deal where Kirkland has offered a 24% premium for Detour. As we detailed in our October commentary, premium all-stock deals historically result in substantial declines in the acquirers’ share price. In addition, large quantities of the stock may wind up in the hands of M&A arbitrageurs, which can churn in the market for months, keeping further pressure on the stock. Unfortunately, this deal has followed the same share price pattern we have seen in past all-stock deals. In the two days following the announcement, Kirkland declined 17.8%, nearly wiping out Detour’s premium. The decline wiped out US$2 billion of Kirkland’s market value.
Shareholders will vote on this deal in January. It will be interesting to see if they accept the recent loss of value in exchange for the promise of a stronger future, or whether they reject a deal structure that has destroyed value for other companies in the past. In our opinion, gold companies that are unwilling or unable to pay cash must find more innovative ways of doing M&A deals that preserve and enhance value for their owners.
IMPORTANT DISCLOSURE
Issued by VanEck Investments Limited ABN 22 146 596 116 AFSL 416755 (‘VanEck’). This is general information only about financial products and not personal financial advice. It does not take into account any person’s individual objectives, financial situation or needs. Before making an investment decision, you should read the relevant PDS and with the assistance of a financial adviser consider if it is appropriate for your circumstances. PDSs are available at www.vaneck.com.au or by calling 1300 68 38 37.
No member of VanEck group of companies gives any guarantee or assurance as to the repayment of capital, the payment of income, the performance, or any particular rate of return of any VanEck funds. Past performance is not a reliable indicator of future performance.
VanEck is the responsible entity and issuer of units in the VanEck Vectors ETFs traded on ASX. All investments carry some level of risk. Investing in international markets has specific risks that are in addition to the typical risks associated with investing in the Australian market. These include currency/foreign exchange fluctuations, ASX trading time differences and changes in foreign regulatory and tax regulations.
NYSE Arca Gold Miners Index is a trademark of ICE Data Indices, LLC or its affiliates (“ICE Data”) and has been licensed for use by VanEck in connection with the US Fund. Neither the Trust nor the Fund is sponsored, endorsed, sold or promoted by ICE Data. ICE Data makes no representations or warranties regarding the Trust or the Fund or the ability of the NYSE Arca Gold Miners Index to track general stock market performance.
ICE DATA MAKES NO EXPRESS OR IMPLIED WARRANTIES, AND HEREBY EXPRESSLY DISCLAIMS ALL WARRANTIES OF MERCHANTABILITY OR FITNESS FOR A PARTICULAR PURPOSE WITH RESPECT TO THE NYSE ARCA GOLD MINERS INDEX OR ANY DATA INCLUDED THEREIN. IN NO EVENT SHALL ICE DATA HAVE ANY LIABILITY FOR ANY SPECIAL, PUNITIVE, INDIRECT, OR CONSEQUENTIAL DAMAGES (INCLUDING LOST PROFITS), EVEN IF NOTIFIED OF THE POSSIBILITY OF SUCH DAMAGES.
Please note that the information herein represents the opinion of the author, but not necessarily those of VanEck, and this opinion may change at any time and from time to time. Non-VanEck proprietary information contained herein has been obtained from sources believed to be reliable, but not guaranteed. Not intended to be a forecast of future events, a guarantee of future results or investment advice. Historical performance is not indicative of future results. Current data may differ from data quoted. Any graphs shown herein are for illustrative purposes only. No part of this material may be reproduced in any form, or referred to in any other publication, without express written permission of VanEck.
©2019 VanEck


Published: 05 December 2019