Come together, right now (over gold)
Consolidation continues as gold exhibits resilience
Complacency in the stock market was on full display in October as the S&P 500 reached a new all-time high, while releases for the Institute for Supply Management (ISM) Manufacturing and Non-Manufacturing indices, payrolls, retail sales, durable goods orders, industrial production, and Conference Board consumer confidence all fell and/or missed expectations. The weak economic results caused the US dollar index to fall from the top to the bottom of its 2019 range in October. While the weak dollar was supportive of gold in October, the normally strong inverse correlation has been absent this year. The gold price continued to consolidate its 2019 gains in a narrow range between US$1,480 and US$1,510 per ounce. Gold was contained in October due to the negative correlation it has shown with the stock market this year, along with a monthly rise in interest rates. Treasury yields rose even though the Fed cut the Federal Funds Rate, as expected. For the month, gold gained US$40.55 (2.75%) per ounce, to close at US$1,512.94. Gold and gold stocks ended at the top of their recent consolidation range as the Chinese expressed doubts about the chances for a long-term trade deal with the US.
The gold market appears resilient, given the lack of strong catalysts lately. While many measures of the economy have deteriorated, third-quarter GDP growth, while anaemic, came in above expectations and unemployment remains at historic lows. Nonetheless, we believe the potential for systemic financial stress is keeping the gold price elevated as a safe haven asset. What gold investors see that the stock market might be ignoring, in our view, are signs that the post-crisis asset bubble is bursting. Unlike 2000 or 2008, there is no discernible bubble focused on a single asset class. The chart below shows that, instead, the totality of asset values amounts to a historic bubble. Perhaps WeWork’s valuation plunge from US$47 billion to less than US$8 billion and other disappointments in the private company space amount to the beginnings of a bubble bursting which public equities are ignoring?
Household financial assets as a percentage of disposable personal income
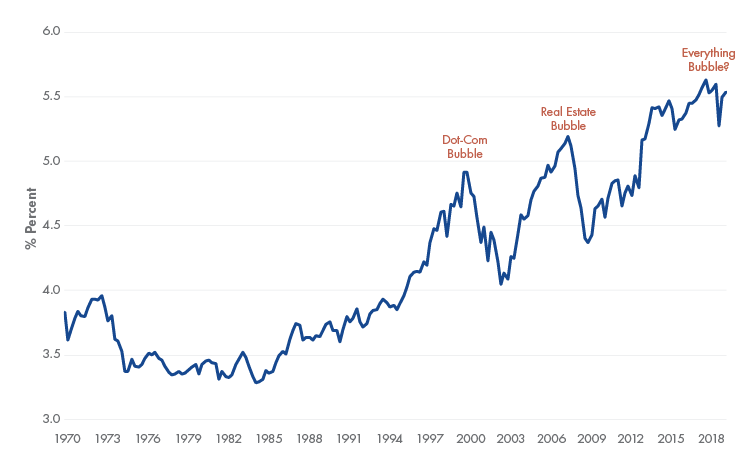
Source: Incrementum AG, St. Louis Federal Reserve, VanEck. Data as of September 2019.
Time for gold singles to mingle?
Of all the mining industries, gold is possibly the most fragmented, and in our view, the gold industry and its investors would realise considerable benefits from consolidation. Pollitt & Co. estimates that, whereas 50% of global iron ore and copper production comes from four and 10 companies, respectively, 25 companies account for just 45% of total gold production.1 Technical talent seems to be spread thin, too. An internal Resource Capital Fund study reported that 107 mining projects that went from feasibility study through to construction were 38% over budget, on average.2
We believe the most potential for synergy and value creation rests among the large number of single-asset companies. Historically, such companies were merger and/or acquisition (M&A) targets for larger producers. However, producers have become reluctant to pursue M&A because:
- Investors have soured on M&A because many companies have overpaid for acquisitions in the past.
- It is very difficult to know all of the risks contained in a target company.
- The strategic focus of most producers has shifted from growth through acquisitions to organic opportunities.
- Many majors are looking to sell non-core assets.
- Deals done at a premium bring arbitrageurs that drive the share price of the acquirer down substantially.
- Much of the share register winds up with arbitrageurs, which churns in the market for months.
- Valuations are low across the sector.
The lack of M&A has resulted in an abundance of single-asset companies. An investment manager may now have a gold portfolio of, for example, approximately 20 single-asset developers and five single-asset producers. These are the companies that are providing many new mine developments across the sector. When investing in a development company, shareholders expect to benefit when the company either gets acquired at a premium or when it successfully takes its project to production. In this M&A environment, developers must plan on becoming mine builders and operators. Once a developer becomes a producer, we expect it to have its next project in view in order to grow into a mid-tier multi-mine company.
An efficient way of unlocking the latent value of one-property companies is through a merger of equals. The benefits of creating larger multi-property companies include:
- Deeper technical talent that is fungible across operations.
- Geopolitical risk that is spread across jurisdictions.
- Procurement scale that enables better pricing for materials and equipment.
- Reduced general and administrative costs (G&A).
- Cheaper access to capital.
- Ability to attract larger institutional investors.
- More opportunities to create value.
Consolidation of single-asset companies to form larger multi-mine companies can unlock these benefits, and the shift in valuation has great potential. For example, let’s create a hypothetical “Mergco” with three companies that are currently single-asset: Detour Gold, Pretium Resources and Sabina Gold & Silver. According their respective September 2019 corporate presentations, Detour and Pretium combined produce roughly 1.1 million ounces per year from their two mines, while Sabina has a shovel-ready project that could produce over 200,000 ounces per year. All are large projects in Canada with long mine lives. Mergco would have a combined market cap of $5.2 billion and, using RBC Capital Markets valuations, trade at a weighted average Price/Net Asset Value (P/NAV) of 0.83X.3 Contrast this with Kirkland Lake, which, according to its September 2019 company reports, also has roughly one million ounces of production, mainly from two mines in safe jurisdictions of Canada and Australia. Kirkland has several exploration and development projects that may bring future growth. It has a market cap of US$9.4 billion and trades at a P/NAV of 1.92 times. We argue that with good management and the advantages of larger scale, Mergco could achieve a valuation that should be closer to Kirkland’s. In a merger of equals, Mergco’s share price would have to increase by 131% to match the P/NAV valuation of Kirkland. Achieving a re-rating of just half of this would still be a windfall to Mergco’s shareholders. In addition, a merger without premiums would reduce arbitrageur positioning, potentially freeing the stock to trade higher.
There are many combinations of single-asset companies around the world that we believe would benefit from such consolidation, so why have we not seen such combinations?
- Management adherence to the old M&A model, hoping to sell the company at a premium.
- Lack of vision among managements, boards and shareholders to achieve such an M&A outcome.
- Entrenched management protecting their jobs.
- Boards with no desire to maximise value for shareholders.
We believe it is time for single-asset gold companies and their shareholders to reconsider the M&A landscape and adapt new strategies that will build the mid-tiers and majors of the future.
IMPORTANT DISCLOSURE
1Pollitt, Douglas. “Gold companies = gold bullion? What everyone seems to want…” Pollitt & Co. October 2018.
2Harris, Paul. “Want investors? Do a better job!” Mining Journal May 2019.
3RBC Capital Markets (8 October 2019). Precious Metals & Minerals Weekly Valuation Tables.
Issued by VanEck Investments Limited ABN 22 146 596 116 AFSL 416755 (‘VanEck’). This is general information only about financial products and not personal financial advice. It does not take into account any person’s individual objectives, financial situation or needs. Before making an investment decision, you should read the relevant PDS and with the assistance of a financial adviser consider if it is appropriate for your circumstances. PDSs are available at www.vaneck.com.au or by calling 1300 68 38 37.
No member of VanEck group of companies gives any guarantee or assurance as to the repayment of capital, the payment of income, the performance, or any particular rate of return of any VanEck funds. Past performance is not a reliable indicator of future performance.
VanEck is the responsible entity and issuer of units in the VanEck Vectors ETFs traded on ASX. All investments carry some level of risk. Investing in international markets has specific risks that are in addition to the typical risks associated with investing in the Australian market. These include currency/foreign exchange fluctuations, ASX trading time differences and changes in foreign regulatory and tax regulations.
NYSE Arca Gold Miners Index is a trademark of ICE Data Indices, LLC or its affiliates (“ICE Data”) and has been licensed for use by VanEck in connection with the US Fund. Neither the Trust nor the Fund is sponsored, endorsed, sold or promoted by ICE Data. ICE Data makes no representations or warranties regarding the Trust or the Fund or the ability of the NYSE Arca Gold Miners Index to track general stock market performance.
ICE DATA MAKES NO EXPRESS OR IMPLIED WARRANTIES, AND HEREBY EXPRESSLY DISCLAIMS ALL WARRANTIES OF MERCHANTABILITY OR FITNESS FOR A PARTICULAR PURPOSE WITH RESPECT TO THE NYSE ARCA GOLD MINERS INDEX OR ANY DATA INCLUDED THEREIN. IN NO EVENT SHALL ICE DATA HAVE ANY LIABILITY FOR ANY SPECIAL, PUNITIVE, INDIRECT, OR CONSEQUENTIAL DAMAGES (INCLUDING LOST PROFITS), EVEN IF NOTIFIED OF THE POSSIBILITY OF SUCH DAMAGES.
Please note that the information herein represents the opinion of the author, but not necessarily those of VanEck, and this opinion may change at any time and from time to time. Non-VanEck proprietary information contained herein has been obtained from sources believed to be reliable, but not guaranteed. Not intended to be a forecast of future events, a guarantee of future results or investment advice. Historical performance is not indicative of future results. Current data may differ from data quoted. Any graphs shown herein are for illustrative purposes only. No part of this material may be reproduced in any form, or referred to in any other publication, without express written permission of VanEck.
©2019 VanEck


Published: 07 November 2019