Cash(flow) is king
This week we’re not going to do the predictable thing and highlight Warren Buffett’s widely publicised investment away from banks into gold, his father was a gold bug and wrote this essay “Human freedom rests on gold redeemable money”.
What we do want to talk about are developments within the gold market.
And the good news for investors is that gold equities are still relatively cheap.
Gold price rally
The strong performance of gold and gold mining equities in 2020 has become widely appreciated. The good news for the miners is that there is still considerable upside relative to the underlying gold price. Since the launch of the NYSE®Arca Gold Miners Index®, miners have historically underperformed bullion because the companies (in aggregate) have tended to over invest in capital expenditure when gold rallied. Moreover, the way to properly value a mining company is not based on the gold price, rather on the net present value of future cash flows.
Performance of Gold Miners and Gold bullion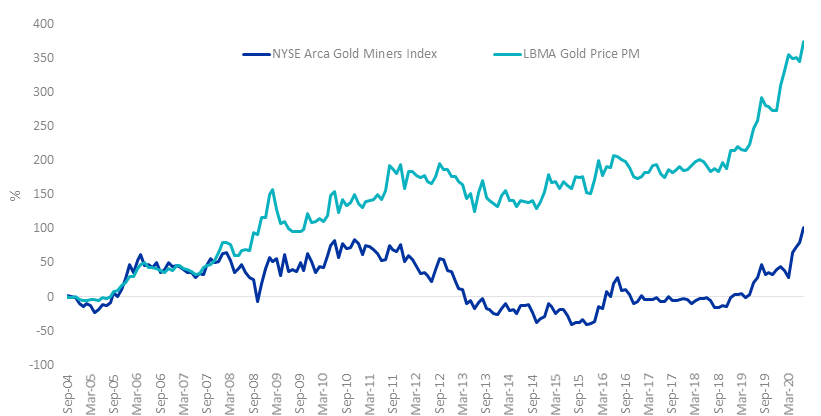
Source: Morningstar Direct, July 2020. All returns in Australian dollars.
Free cash flow of gold miners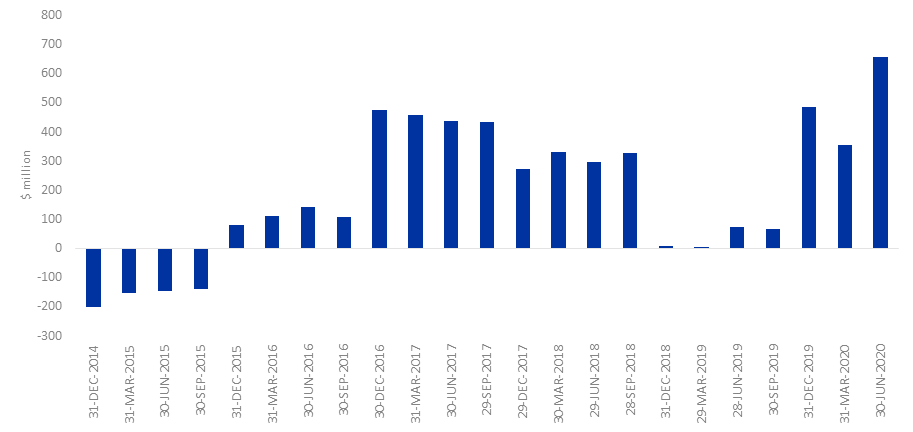
Source: Factset, Gold miners are NYSE Arca Gold Miners Index, weighted average, June 2020
We estimate all-in-mining costs or what it costs a gold miner to extract gold, currently averages around US$900 per ounce. The industry is currently free cash flow (FCF) positive above approximately US$1,100. The US$500 rise in the gold price in the first seven months of 2020 has resulted in strong double digit increases in free cash flow.
Average All-In Mine Costs (Seniors/Mid-Tiers)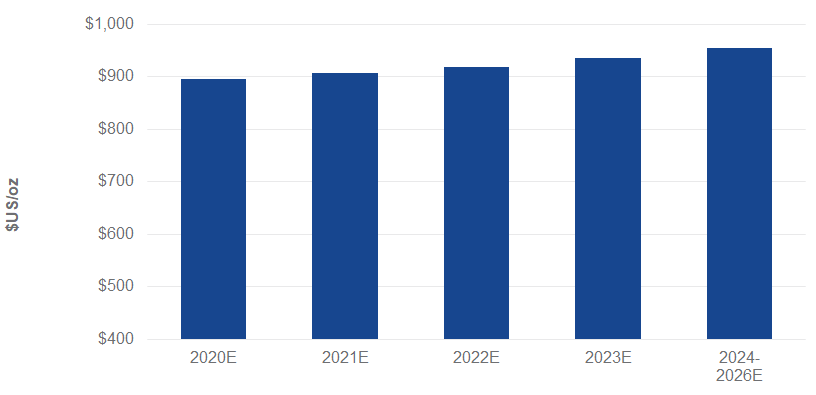
2021 FCF At Varying Gold Prices (Seniors/Mid-Tiers)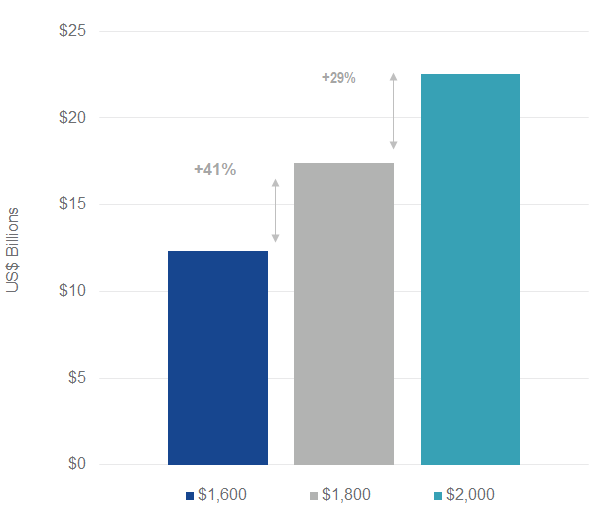
Source: VanEck, Company Reports. Data as of June 2020. Seniors miners produce approximately 1.5-6.0 million ounces of gold per year. Mid-Tier miners produce approximately 0.3-1.5 million ounces of gold per year. Junior miners (not pictured) produce approximately less than 0.3 million ounces of gold per year. Data displayed for Major and Mid-Tier miners. FCF represents a company’s free cash flow. Past performance is no guarantee of future results.
And the good news for investors is that gold equities are still relatively cheap. Major and Mid-Tier miner price/cash flow (P/CF) valuations have been below average in recent years.
Historical P/CF of Majors and Mid-Tiers (2006 – 2020)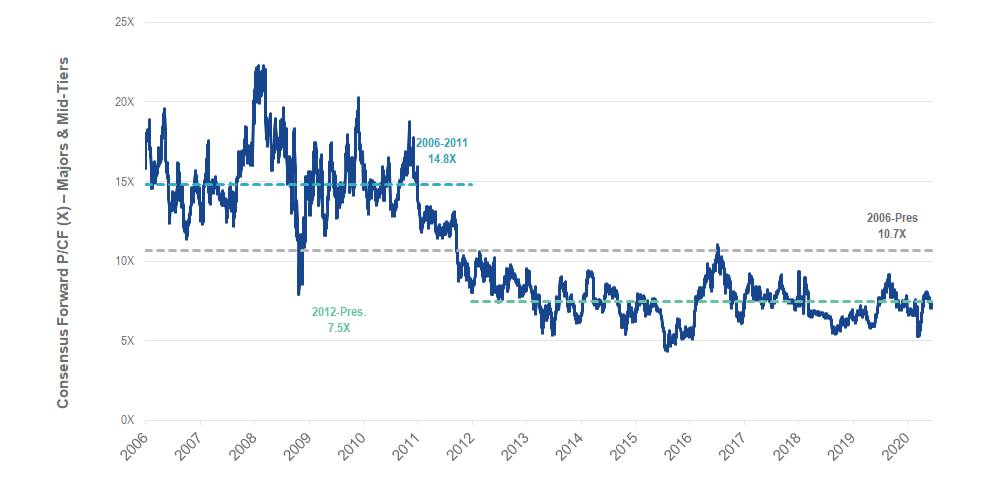
Adjusted P/NAV of North American Gold Producers (at Gold Spot)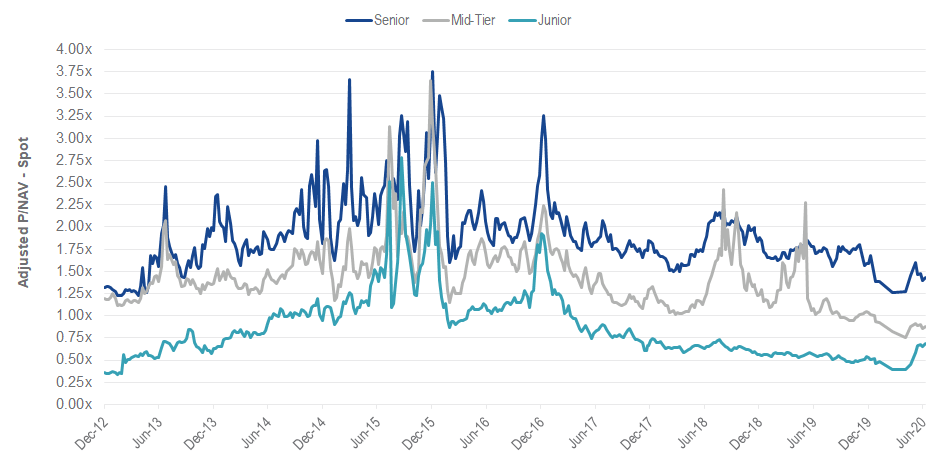
Source: RBC Capital Markets. Data as of June 2020. P/CF represents a company’s stock price to cash flow. P/NAV represents a company’s stock price to net asset value. Senior (or Major), Mid-Tier, and Junior miners are classifications developed by RBC Capital Markets based on their coverage universe and represent the amount of gold production by these companies. Seniors/Majors tend to be larger companies and produce the most gold per year followed by Mid-Tier miners which tend to be slightly smaller and produce less gold. Junior miners tend to be smaller exploratory companies that produce little or no gold at present. Past performance is no guarantee of future results.
In conclusion, we are always wary of a market, sector or stock when the price starts to move in a non-linear, rapid and emotional way. However, the key point to note is that gold miners have:
• lagged the rally in spot gold since 2014;
• strong free cash flow support; and
• remain undervalued.
We expect there to be short term corrections along the way but the extreme policy response to this crisis has been a genuine support for the decline in real yields (competing asset for gold) and the risk of future, 1970s-style inflation episode once the US economy recovers next year. This is supportive for the continued gold bull-market.
Investors can access the opportunity to invest in gold miners on NYSE with GDX, the world’s largest gold miners ETF. Across its whole portfolio, Canadian firms account for slightly less than half (~44%) of GDX’s holdings, with the US (~18%) and Australia (~14%) rounding off the top three geographic exposures as at 31 July 2020. GDX also holds the world’s largest gold miners Newmont and Barrick Gold.
Invest Now
>
Learn More
>


Published: 27 August 2020
NYSE®Arca Gold Miners Index®is a trademark of ICE Data Indices, LLC or its affiliates (“ICE Data”) and has been licensed for use by VanEck in connection with the US Fund. Neither the Trust nor the Fund is sponsored, endorsed, sold or promoted by ICE Data. ICE Data makes no representations or warranties regarding the Trust or the Fund or the ability of the NYSE Arca Gold Miners Index to track general stock market performance.
ICE DATA MAKES NO EXPRESS OR IMPLIED WARRANTIES, AND HEREBY EXPRESSLY DISCLAIMS ALL WARRANTIES OF MERCHANTABILITY OR FITNESS FOR A PARTICULAR PURPOSE WITH RESPECT TO THE NYSE ARCA GOLD MINERS INDEX OR ANY DATA INCLUDED THEREIN. IN NO EVENT SHALL ICE DATA HAVE ANY LIABILITY FOR ANY SPECIAL, PUNITIVE, INDIRECT, OR CONSEQUENTIAL DAMAGES (INCLUDING LOST PROFITS), EVEN IF NOTIFIED OF THE POSSIBILITY OF SUCH DAMAGES.
No member of VanEck group of companies gives any guarantee or assurance as to the repayment of capital, the payment of income, the performance, or any particular rate of return of any VanEck funds. Past performance is not a reliable indicator of future performance.