Gold Finds Synergies as Macro Views Diverge
Gold market sees several course reversals in March
After six months of gains in which the gold price rose by US$175 per ounce to US$1,345, March saw some profit-taking. The price of the yellow metal fell to its monthly low of US$1,280 at one point, before recovering on the back of a lacklustre February US jobs report and the European Central Bank’s (ECB) plan to hold interest rates at their current low levels until the end of the year at least, months longer than previously signalled. This caused recessionary fears to re-emerge, with long-term US Treasury yields falling to 15-month lows, and the yield curve inverted slightly for the first time since 2007. Gold rose up to US$1,324 on March 25. Towards the month-end, however, a slump in palladium prices led to broad weakness in precious metals . There were also reports of heavy official selling from Turkey to prop up the lira ahead of local elections on March 31. Gold lost about US$21 per ounce, or 1.6%, to end at US$1,292.30 over the month.
Gold stocks more or less matched gold’s performance in March, with the NYSE Arca Gold Miners Index gaining 0.74% and the MVIS Global Junior Gold Miners Index retreating 2.3%.
China expanded its gold reserves for the third consecutive month, raising expectations that central bank demand will remain elevated this year.
Merger mania subsides
First-quarter merger and acquisition (M&A) activity among the supermajors is near a conclusion. Barrick Gold withdrew its hostile offer for Newmont Mining on March 11, when the companies agreed to form a joint venture (JV) to unitise their Nevada operations. The combined unit is expected to produce four million ounces per year and Barrick, as JV operator, estimates it will generate about US$5 billion worth in synergies.
Investor attention was also on the friendly Newmont/Goldcorp merger announced in January. Initially, Goldcorp shareholders were not entitled to the savings from the Nevada JV, as the deal with Newmont did not exist at the time of the merger announcement. Despite that, Newmont decided to award a 2.5% special dividend to its shareholders as a partial upfront payment for future Nevada synergies. The dividend will be distributed if shareholders approve the Newmont/Goldcorp deal in April.
The recent burst of supermajor M&A activity is aimed at creating value for shareholders, improving mine efficiency and generating higher returns on capital. We hope the smaller players would be able to replicate what the supermajors have done. According to Pollitt & Co. Inc., a Toronto-based investment banking and brokerage services firm, just four companies account for 50% of iron ore production, and 10 companies to generate 50% of copper production. Contrast this with gold, where 25 companies account for 45% of production. Mining is a risky business and not all of these companies have an A-team. Management risk can be mitigated by joining strong managements with good properties, thereby enabling companies to optimise operations. M&A also allows smaller companies to gain the critical mass needed to efficiently access capital markets and strike better deals for materials, equipment, and services.
Diverging macro signals hint at risks ahead
Successful investing involves making the right call at the right time. A great investment idea can fail if the timing is off. We have been warning of the risks of recession for several years. As such, the portfolio is positioned aggressively for a stronger gold market. While gold and gold stocks have exhibited positive returns in two of the last three calendar years – perhaps driven by global systemic risks – we were certainly much too early on the recession call. Two years ago we shared this chart as a compelling indicator of a looming recession. Following a recent update, the chart is even more compelling.
Divergence Between Sentiment and Consumption Precedes Recessions
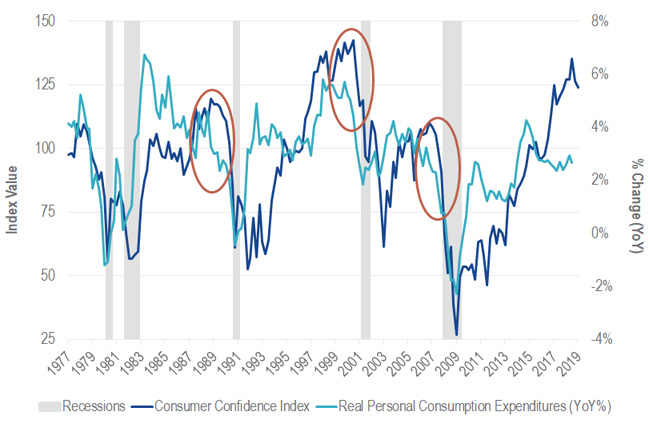
Source: St. Louis Federal Reserve Bank, Bloomberg. Data as of March 2019.
Notice the divergence between the “hard” consumption data and the “soft” consumer confidence data ahead of each recession. Sentiment remains strong before a recession, while actual economic indicators are weakening, and this time the divergence has become more pronounced. We believe this chart, combined with other late-cycle indicators, stock market volatility, bond market action, and central bank behavior all suggest a recession remains in the forecast and probably may occur sooner than many expect. If the economy tumbles into recession, we expect financial risks to escalate that drive gold higher.
US federal debt is growing fast
Federal debt stands at about 75% of US gross domestic product (GDP) and is growing rapidly. Trillion-dollar annual deficits were first seen in the Obama administration, and now President Donald Trump’s policies will again drive deficits through the trillion-dollar mark (4.5% of GDP) beginning in 2022, according to the Congressional Budget Office (CBO). Unlike in the Obama years, politicians rarely complained about the debt level. Spending more is easy, while cutting budgets seems politically impossible in Washington. Because of this, we believe a debt crisis is imminent, although the breaking point is difficult to forecast. It may come in the next recession, or at a time when rates spike as foreign holders of US Treasuries lose confidence in Washington. Failure to cut spending or increase taxes to boost revenues as growth weakens could lead to two ways of handling US debt: default or monetisation.
Modern monetary theory is not the answer
Some politicians appear prepared for debt monetisation. So far, no adverse consequences of the sovereign debt build-up have shown up in the financial system. Meanwhile, easy monetary and fiscal policies have not sparked inflationary pressures in consumer prices. As a result, a radical form of financial thinking has emerged called Modern Monetary Theory (MMT). Key characteristics of MMT include:
- Any country that prints its own currency can do so to pay national debts or finance deficits.
- Deficits don’t matter as long as interest rates remain below GDP growth.
- The natural rate of interest in a fiat currency world is 0%.
- Inflation can be controlled through taxation, rate increases, and regulation of big business.
- Economies should be guided by fiscal policy, i.e., government spending and taxation.
- The Central Bank would essentially be controlled by the Treasury.
Prominent economists and financial leaders have characterised MMT as “fallacious”, “garbage”, and “just wrong”. We agree with these characterisations. If adopted, MMT would likely lead to currency debasement and hyper-inflation on a scale seen in Weimar Germany almost 100 years ago or in modern-day Venezuela. Bond prices might collapse with the US dollar, and a financial crisis would probably ensue long before MMT is implemented in its full form.
An alternative would be to invest in a reasonably valued asset class with a proven track record, has an alternative store of value and negative correlation to the US dollar. For that, one need not look any further than gold and gold shares.
IMPORTANT NOTICE: Issued by VanEck Investments Limited ABN 22 146 596 116 AFSL 416755 (‘VanEck’). VanEck is a wholly owned subsidiary of Van Eck Associates Corporation based in New York, United States. VanEck Vectors ETF Trust ARBN 604 339 808 (the ‘Trust’) is the issuer of shares in the VanEck Vectors Gold Minders index ETF (‘US Fund’). The Trust and the US Fund are regulated by US laws which differ from Australian laws. Trading in the US Fund’s shares on ASX will be settled by CHESS Depositary Interests (‘CDIs’) which are also issued by the Trust. The Trust is organised in the State of Delaware, US. Liability of investors is limited. VanEck Associates serves as the investment adviser to the US Fund. VanEck, on behalf of the Trust, is the authorised intermediary for the offering of CDIs over the US Fund’s shares and issuer in respect of the CDIs and corresponding Fund’s shares traded on ASX.
This information contains general advice only about financial products and is not personal advice. It does not take into account any person’s individual objectives, financial situation or needs. Investing in international markets has specific risks that are in addition to the typical risks associated with investing in the Australian market. These include currency/foreign exchange fluctuations, ASX trading time differences and changes in foreign laws and tax regulations. Before making an investment decision in relation to a fund, you should read the PDS and with the assistance of a financial adviser consider if it is appropriate for your circumstances. The PDS is available at www.vaneck.com.au or by calling 1300 68 38 37.
Past performance is not a reliable indicator of future performance. No member of the VanEck group of companies or the Trust gives any guarantee or assurance as to the repayment of capital, the payment of income, the performance or any particular rate of return from the US Fund.
An investment in the US Fund may be subject to risks that include, among others, competitive pressures, dependency on the price of gold and silver bullion that may fluctuate substantially over short periods of time, periods of outperformance and underperformance of traditional investments such as bonds and stocks, and natural disasters, all of which may adversely affect the US Fund. Foreign investments are subject to risks, which include changes in economic and political conditions, foreign currency fluctuations, changes in foreign regulations, and changes in currency exchange rates that may negatively impact the US Fund’s return. Small- and medium- capitalisation companies may be subject to elevated risks. The US Fund’s assets may be concentrated in a particular sector and may be subject to more risk than investments in a diverse group of sectors.
NYSE Arca Gold Miners Index is a trademark of ICE Data Indices, LLC or its affiliates (“ICE Data”) and has been licensed for use by VanEck in connection with the US Fund. Neither the Trust nor the Fund is sponsored, endorsed, sold or promoted by ICE Data. ICE Data makes no representations or warranties regarding the Trust or the Fund or the ability of the NYSE Arca Gold Miners Index to track general stock market performance.
ICE DATA MAKES NO EXPRESS OR IMPLIED WARRANTIES, AND HEREBY EXPRESSLY DISCLAIMS ALL WARRANTIES OF MERCHANTABILITY OR FITNESS FOR A PARTICULAR PURPOSE WITH RESPECT TO THE NYSE ARCA GOLD MINERS INDEX OR ANY DATA INCLUDED THEREIN. IN NO EVENT SHALL ICE DATA HAVE ANY LIABILITY FOR ANY SPECIAL, PUNITIVE, INDIRECT, OR CONSEQUENTIAL DAMAGES (INCLUDING LOST PROFITS), EVEN IF NOTIFIED OF THE POSSIBILITY OF SUCH DAMAGES.
Please note that the information herein represents the opinion of the author, but not necessarily those of VanEck, and this opinion may change at any time and from time to time. Non-VanEck proprietary information contained herein has been obtained from sources believed to be reliable, but not guaranteed. Not intended to be a forecast of future events, a guarantee of future results or investment advice. Historical performance is not indicative of future results. Current data may differ from data quoted. Any graphs shown herein are for illustrative purposes only. No part of this material may be reproduced in any form, or referred to in any other publication, without express written permission of VanEck.


Published: 05 April 2019