The rhyme of history
History doesn’t repeat itself but it does rhyme, according to Mark Twain. We explore the rhymes between today’s equity markets and the markets back in 1999.
The quote “History doesn’t repeat itself but it does rhyme” has been attributed to Mark Twain.
The rhymes between today’s equity markets and the markets back in 1999 have been drawn by a number of industry pundits over recent weeks:
- IPOs hitting 1999-like numbers;
- Technology is dominating the performance of the US equity markets; and
- Retail investors flooding the markets.
This time much of the performance of the US equity markets has been driven by just a handful of stocks – FAANGM stocks. If they fall, the whole US market will fall with it.
September’s volatility of the NASDAQ, in particular, has highlighted the importance of considering company valuations.
Another similarity of 1999 is that emerging markets, relative to developed markets are cheap.
Developed market bubble?
While the FAANGM giants, Facebook, Amazon, Apple, Netflix, Google owner, Alphabet and Microsoft, have been powering the returns of the S&P 500 and NASDAQ, their tumble in September reveals that that momentum could stop at any time.
Investors that have had these FAANG stocks in their portfolio have been well served by soaring valuations. But how high can they continue to go?
These concerns have caused many investors to wonder if we are witnessing another tech bubble as we did in 1999. Some of the similarities are eerily reminiscent of those heady days. IPO activity was the most active in the past 20 years by proceeds from IPOs and the second highest third quarter by deal numbers in the third quarter of 2020, according to the Global IPO trends: Q3 2020 report published by EY and Dealogic. Additionally, retail investors this time around, or ‘Robinhood investors’, are propping up volumes and liquidity.
It was also at the turn of the century that emerging market equities were cheap relative to developed markets. Now emerging markets haven’t been this cheap, relative to developed markets since 2017.
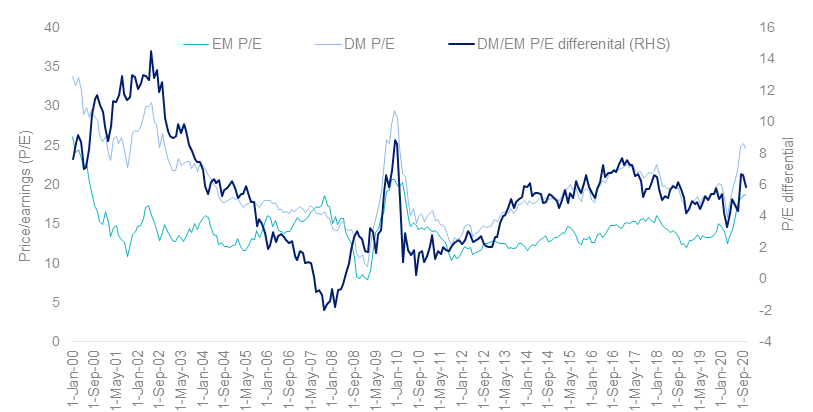
Source: MSCI, as at 31 October 2020, EM is MSCI Emerging Markets Index. DM is MSCI World ex Australia Index. P/E differential is DM P/E minus EM/P/E.
|
Fundamentals as at 31 October 2020 |
EM |
DM |
|
Return on equity |
15.4 |
11.5 |
|
Long term debt to Capital |
19.9 |
38.8 |
|
Historic 3 year Sales Growth |
19.5 |
11.2 |
|
Historic 3 EPS Growth |
17.9 |
19.9 |
|
Price/Earnings* |
16.8 |
23.1 |
|
Dividend Yield* |
0.7 |
1.1 |
|
Price/Book* |
1.8 |
2.4 |
|
Price/Sales* |
1.3 |
1.7 |
|
Market Cap Weighted Average (A$m) |
246,405 |
427,919 |
Source: FactSet, as at 31 October 2020, EM is MSCI Emerging Markets Index. DM is MSCI World ex Australia Index.
Continued US dollar weakness
Beyond valuations, there are other reasons to consider emerging market equities in the current environment, including a weaker US dollar.
The US dollar has fallen since the COVID-19 crisis as the US Government and the Fed implement unprecedented monetary and fiscal policies. US Federal debt is at just over US$20 trillion and is expected to increase another US$13 trillion in the next decade, according to the Congressional Budget Office, driven by slow growth, an aging population, rising health care costs and debt service payments. This all puts pressure on the US dollar, which generally benefits emerging market equities.
If history does rhyme
In recent years, emerging markets have underperformed developed markets dramatically, as the table below shows, with gains of just 4.62%p.a. from 1 January 2018 to 31 October 2020, underperforming developed markets by 4.64%. However, emerging markets have outperformed developed market equities significantly over the long term but it's been a rocky ride.
Australian investors with global equity portfolios that had exposure to emerging markets equities were rewarded in the aftermath of the 1999 tech crash. They then underperformed in the aftermath of the GFC, prior to a stellar year in 2017. Since then, emerging markets have underperformed developed markets as the US dollar surged.
But this could change in the months and years ahead.
Annualised and cumulative returns for EM versus DM over past 20 years
|
|
Annualised returns |
Cumulative returns |
||
|
|
MSCI Emerging Markets Index |
MSCI World ex Australia Index |
MSCI Emerging Markets Index |
MSCI World ex Australia Index |
|
2001 to 2007 |
15.80% p.a. |
-1.43% p.a. |
179.26% |
-9.56% |
|
2008 to 2016 |
0.48% p.a. |
5.56% p.a. |
4.37% |
62.74% |
|
2017 |
27.09% p.a. |
13.38% p.a. |
27.09% |
13.38% |
|
2018 to 2020 October |
4.62% p.a. |
9.26% p.a. |
13.67% |
28.50% |
|
Performance 2001 to 2020 May |
7.52% p.a. |
3.92% p.a. |
321.08% |
114.44% |
Source: Bloomberg, Morningstar Direct. Performance results shown are for indices and not EMKT. You cannot invest in an index. Data is in Australian dollars. Returns are calculated monthly and assume immediate reinvestment of all dividends. Past performance of the indices is not a reliable indicator of future performance of EMKT.
A smarter way to invest in EM equities
Investing in emerging markets has traditionally been expensive and returns among active managers vary significantly from year to year because it is almost impossible for active managers to time factors in emerging markets.
The VanEck Vectors MSCI Multifactor Emerging Markets Equity ETF (ASx code: EMKT) provides investors with access to a diversified portfolio of emerging markets companies that demonstrate four factors: Value, Momentum, Low Size and Quality.


Published: 16 November 2020
An investment in EMKT carries risks associated with: emerging markets, financial markets generally, individual company management, industry sectors, ASX trading time differences, foreign currency, country or sector concentration, political, regulatory and tax risks, fund operations, liquidity and tracking an index. See the PDS for details.
EMKT is indexed to a MSCI index. EMKT is not sponsored, endorsed or promoted by MSCI, and MSCI bears no liability with respect to EMKT or the MSCI Index. The PDS contains a more detailed description of the limited relationship MSCI has with VanEck and EMKT.