Policy response and growth/rates dichotomy
The decline in the US Treasury yields looks relentless, the 10-year yield fell as low as 1.13-1.14% yesterday. And it contrasts with the consensus outlook for the US GDP growth, the 2021 forecast is still unchanged at 6.6% despite concerns about the virus mutations, and the 2022 forecast was recently raised for to 4.2%. The outlooks for other major global growth drivers (China and the Eurozone) also look fine. The dichotomy between the rates’ dynamics and the growth outlook explains heightened interest in the upcoming policy communications by the European Central Bank (ECB, on July 22) and the US Federal Reserve (July 28).
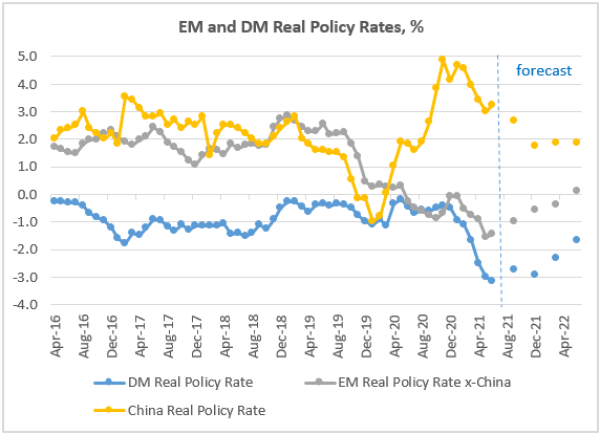
Meanwhile in emerging markets (EM), China’s decision to keep both 1-year and 5-year Loan Prime Rates on hold was widely interpreted as a sign that the growth downside is limited, so “sharper” policy turns can be avoided for now. The next big test will come at the end of the month, when we get China’s activity gauges (PMIs) for July. As a reminder, China’s real policy rate is among the highest in the world (see chart below), so there is room for further adjustment (if necessary).
The chart below also shows that the average real policy rate in EM ex-China is still very much negative, despite the recent hikes. This is because EM inflation has been trending up as well. And this means that the “policy cushion” for some assets, such as currencies, is still thin. The consensus sees more rate hikes in EM going forward, but the expectation is that the fading low base effect in prices will be disinflationary (other things equal). Under this scenario, the average real policy rate in EM ex-China should be back in positive territory by Q2-2022.
Charts at a glance: policy response and growth/rates dichotomy
Source: VanEck Research; Bloomberg LP


Published: 20 July 2021