Davids and Goliaths
As we reflect on the recent reporting season in Australia, results could best be described as mixed.
Trawling through the analysis, one table in a recent Australian Financial Review captured our attention about the winners (highlights of the table are shown below).
Reporting season winners came from the entire market capitalisation spectrum, however, in terms of share price performance, those outside the top 10 appear to have won more.
As an example, what the table in the article illustrates is that while CSL was a reporting season winner, its share price is only up 5.1% YTD while a much smaller company like JB Hi-Fi which was also a reporting season winner and has experienced a share price rise of over 35% so far this year.1
Likewise, mega miner BHP earned more on the resurgence of the iron ore price, but its share price is down 3.1% YTD, meanwhile Fortescue Metals which has also benefited from the rise of the price of iron is up a whopping 76.5% YTD.1
This highlights the importance of having more meaningful exposures beyond the mega caps, where growth is limited, to better capture the potential greater upside of companies outside the top 10.
Take your pick
|
Trend leaders and why they’re ahead |
|||||
|
Comment |
52-week high ($) |
52-week low ($) |
Current price ($) |
Change YTD (%) |
|
|
Flight to quality |
|||||
|
BHP |
Huge iron ore earnings and strong shareholder returns underpins resilience. |
41.24 |
25.20 |
37.73 |
-3.1 |
|
CBA |
Result and better-than-expected dividend confirmed CBA’s place as Australia’s dominant bank. |
90.99 |
54.26 |
69.06 |
-13.5 |
|
CSL |
Simply one of the world’s best life science companies, which could see further growth from a COVID-19 vaccine. |
341.00 |
229.03 |
289.89 |
+5.1 |
|
Fortescue Metals |
Tiny debt, huge dividends and room to grow. Well placed to keep generating big profits if iron ore price holds. |
19.30 |
7.66 |
18.87 |
+76.5 |
|
JB Hi-Fi |
Arguably Australian best retailer. Will come under pressure as economy stagnates but low costs provide resilience. |
52.40 |
23.50 |
51.16 |
+35.8 |
|
Digital winners |
|||||
|
Afterpay |
Its valuation is clearly silly, but it’s riding the combined wave of digital payments and e-commerce growth. |
92.48 |
8.90 |
88.75 |
+203.1 |
|
Woolworths |
Online sales rose 41.8 per cent in 2020 and look set to hold at elevated levels. |
43.60 |
34.16 |
39.77 |
+10.0 |
Source: Australian Financial Review, The four trends that shaped profit season, 28 August 2020. Full table can be accessed here.
Earnings surprises
As Australian companies wrapped up reporting season in what has been the toughest economic environment to date, many of them have encountered varied results. Overall profits were down and dividend payments were slashed or cut. There were some bright spots and many of the upside surprises came outside of the top 10.
JB Hi-Fi’ reported a record year to 30 June, with its statutory net profit jumping 21 per cent to $302.3 million. Along with record sales, its shares hit a record high over $50. As COVID-19 forced people home, its online sales jumped 50 per cent across the year to nearly $600 million to account for 7.5 per cent of the company’s total sales, with internet sales jumping 134 per cent in the June quarter alone. JB Hi-Fi also announced a final dividend of 90 cents a share, fully franked, up 39 cents on the previous period, this was a surprise at a time other companies were slashing shareholder payments. JB HI Fi’s share price is up over 35% so far in 2020.1
Another strong result came from Afterpay, the buy-now, pay-later market star. The company posted a profit of $519.2 million for the 2020 financial year, and its shares soared to a record high of $95.97. It has quickly moved through the ranks of being a small-cap to become a mid to large-cap all in the space of a year. The company’s online sales jumped as new merchants signed up during the COVID-19 period, boosted by the demand for online shopping. Its share price is up over 200% YTD.1
Fortescue Metals Group also announced strong results. With rising prices for iron ore, and still strong demand from China, Fortescue's profit jumped 49% to $US4.7 billion (US$6.5 billion) for the full year. This result exceeded market analysts' forecasts, and the miner announced a higher-than-expected full-year dividend of $1 a share, bringing total dividends for the year to $1.76 a share. Fortescure Metals share price is up over 75% YTD.1
The top 10 drag
While some companies in the top 10 posted strong results, because these companies are so well researched and so big, the share price movements of these companies do not reflect these strong results as much as the smaller companies.
- CSL announced strong results in August and its share price is up over 5% so far in 2020.
- CBA was the best performing bank but its share price is down 13.8% YTD.1Woolworths, like JB Hi Fi, was a digital winner as many consumers opted for online shopping to avoid crowded supermarkets but its strong results were only enough to muster a 10% share price increase YTD.1
Consider some of the other mega caps:
- Telstra’s share price is down 18.2%.1
- Westpac, ANZ and NAB’s share prices are all down over 25% YTD.1
Australian banks asset quality (read: mortgages and business loans) continues to dominate the short-term outlook for the banking sector. Australian banks capital positions look strong, and APRA’s remit for banks to absorb the upcoming headwinds is clear. Underlying trends are challenging with Net Interest Margin (NIM) headwinds, subdued credit growth and increased costs, all impacting earnings. While current valuations seem to be priced relative to previous downturns when government support is withdrawn only then will we see the reality of the adequacy of the loan loss provisions. Taking a more neutral approach to bank weightings in a core Australian equity portfolio is prudent now more than ever.
Putting it together
It is important that you have meaningful exposure to those companies outside of the mega caps to harvest their greater potential share price increases.
VanEck Vectors Australian Equal Weight ETF (MVW) equally weights the largest and most liquid stocks on the ASX at each rebalance. As a result, it is underweight the broader big banks and other mega-caps, relative to the S&P/ASX 200. As at 31 August 2020, MVW’s portfolio is underweight mega-caps by 20.06% and overweight large-cap (+3.24) and mid-cap (+16.86) stocks.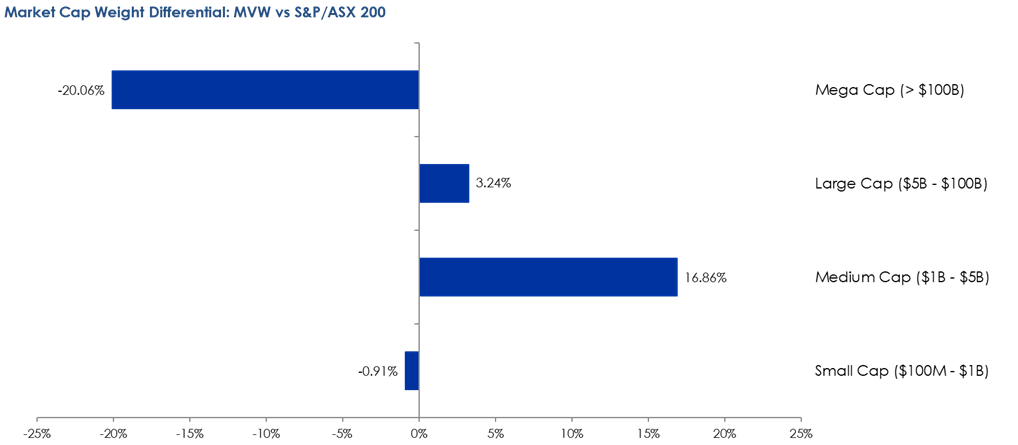
Source: Facstet (LHS) and Bloomberg (RHS) both as at 31 August 2020.
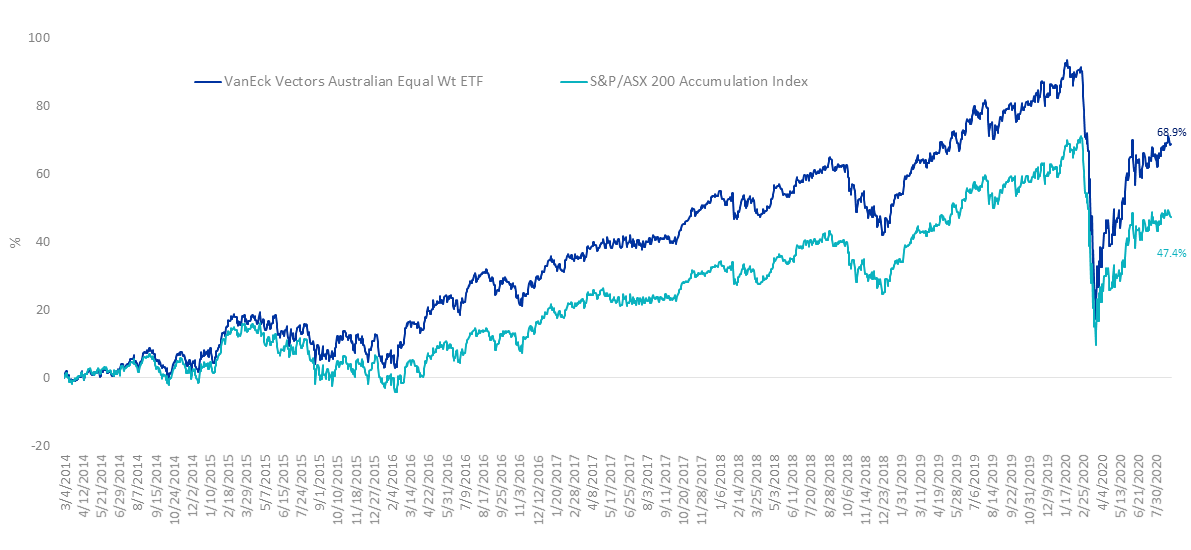
Further, an analysis of returns of the stocks in the S&P/ASX 200 demonstrates how equally weighting an Australian equity portfolio can result in outperformance relative to the market capitalisation benchmark because of this overweight exposure to ‘smaller’ companies. This is outlined here and here.
The result is a portfolio that can demonstrate long term outperformance.
MVW performance
Cumulative performance of MVW since inception to 31 August 2020
|
1 mth (%) |
3 mths (%) |
6 mths (%) |
1 yr (%) |
3 yrs (% p.a.) |
5 yrs (% p.a.) |
Since inception* (% p.a.) |
|
|
VanEck Vectors Australian Equal Weight ETF (MVW) |
4.18 |
6.71 |
-1.09 |
-4.42 |
6.21 |
9.18 |
8.41 |
|
S&P/ASX 200 Accumulation Index |
2.83 |
6.04 |
-4.48 |
-5.08 |
6.10 |
7.46 |
6.15 |
|
Difference |
+1.35 |
+0.67 |
+3.39 |
+0.66 |
+0.11 |
+1.72 |
+2.26 |
*Inception date is 4 March, 2014.
Source: Morningstar Direct, as at 31 August 2020. Results are calculated daily to the last business day of the month and assume immediate reinvestment of all dividends. MVW results are net of management fees and other costs incurred in the fund but do not include brokerage costs and buy/sell spreads incurred when investing in MVW. Past performance is not a reliable indicator of future performance.
For a copy of research reports or for more information on MVW please visit our website.
* For more information on the Herfindahl Index click here
1 All Year to date stock performance is 31 December 2019 to 27 August 2020. Source: AFR, Bloomberg. Not a recommendation of any individual stock. Past performance is not a reliable indicator of future performance.


Published: 07 September 2020
MVIS Australia Equal Weight Index (‘MVIS Index’) is the exclusive property of MV Index Solutions GmbH based in Frankfurt, Germany (‘MVIS’). MVIS is a related entity of VanEck. MVIS makes no representation regarding the advisability of investing in the Fund. MVIS has contracted with Solactive AG to maintain and calculate the MVIS Index. Solactive uses its best efforts to ensure that the MVIS Index is calculated correctly. Irrespective of its obligations towards MVIS, Solactive has no obligation to point out errors in the MVIS Index to third parties.