Beta sweet concentration
Markets are in a constant flux and investors should be mindful how potential market composition changes will affect their portfolios. The S&P/ASX 200 is about to experience a paradigm shift, the proposed amalgamation of BHP’s Australian and UK listed entities.
The S&P/ASX 200 is about to experience a paradigm shift, the proposed amalgamation of BHP’s Australian and UK listed entities.
Markets are in a constant flux and investors should be mindful how potential market composition changes will affect their portfolios.
The S&P/ASX 200 is about to experience a paradigm shift, the proposed amalgamation of BHP’s Australian and UK listed entities.
For an Australian equity allocation, the S&P/ASX 200 benchmark has and continues to be the widely accepted beta – an index concentrated by stock and sector, a point we have harboured on for many years.
Thanks to the unification of BHP PLC and Ltd, the S&P/ASX 200 is about to get even more concentrated changing the dynamic of the risk/return characteristics of the benchmark – our own analysis shows that it will have an even greater cyclical exposure.
Investors buying an Australian equity strategy that contains 200 companies would think it is unlikely one stock would be 10% of the portfolio, nor would two sectors represent over 50% of the portfolio, but that is what you will be getting from a portfolio linked to Australia’s largest 200 companies.
Concentration
The S&P/ASX 200 is among the most concentrated single country benchmark indices in the world. As at the end of November, the 10 largest companies represented 43.45% of the index, the top 20, 57.90%. Earlier this year BHP announced its intention to move its main listing from the London bourse to the ASX. According to Morgan Stanley, as reported in last week’s Australian Financial Review, the consolidation will result in BHP becoming the biggest company on ASX, making up an estimated ~9.5% of the market capitalisation index. It has not been that high since 2012, as global demand for resources slowed down following the super commodity cycle. BHP’s rise in the Australian index will not be due to a return to the heady days of the super commodity cycle.
Figure 1: BHP’s representation in the S&P/ASX 200 since 2000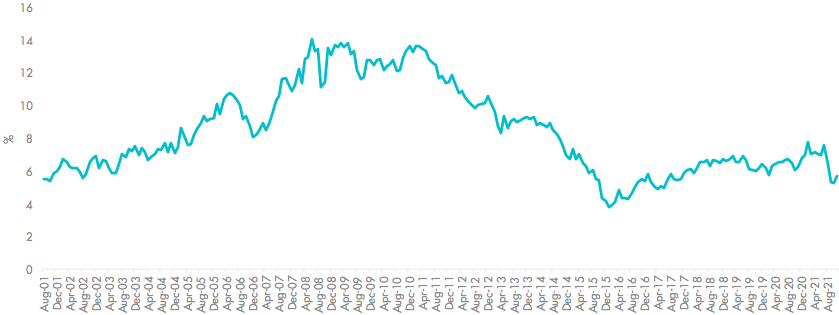
Source: FactSet, as at 30 November 2021
The imminent rising proportion of BHP, affects other companies as their relative share of the S&P/ASX 200 shrinks. VanEck analysis suggests CBA’s share of the S&P/ASX 200 would go down from 8.1 per cent to 7.8 per cent. CSL would go from 6.6 per cent to 6.3 per cent of the index, while NAB would slide from 4.5 per cent to 4.3 per cent.
Table 1: Top 20 Holdings in S&P/ASX 200 before and after BHP unification
|
Company |
Sector |
New |
Old |
Change |
|
BHP |
Materials |
10.9% |
6.7% |
4.2% |
|
CBA |
Financials |
7.8% |
8.1% |
-0.4% |
|
CSL |
Health Care |
6.3% |
6.6% |
-0.3% |
|
NAB |
Financials |
4.3% |
4.5% |
-0.2% |
|
ANZ BANKING |
Financials |
3.6% |
3.8% |
-0.2% |
|
WESTPAC |
Financials |
3.6% |
3.7% |
-0.2% |
|
MACQUARIE GROUP |
Financials |
3.3% |
3.5% |
-0.2% |
|
WESFARMERS |
Consumer Discretionary |
3.1% |
3.3% |
-0.1% |
|
WOOLWORTHS |
Consumer Staples |
2.3% |
2.4% |
-0.1% |
|
TELSTRA |
Communication |
2.2% |
2.3% |
-0.1% |
|
TRANSURBAN |
Industrials |
2.0% |
2.1% |
-0.1% |
|
GOODMAN |
Real Estate |
2.0% |
2.0% |
-0.1% |
|
RIO TINTO |
Materials |
1.6% |
1.7% |
-0.1% |
|
ARISTOCRAT LEISURE |
Consumer Discretionary |
1.4% |
1.4% |
-0.1% |
|
FORTESCUE |
Materials |
1.4% |
1.4% |
-0.1% |
|
JAMES HARDIE |
Materials |
1.2% |
1.2% |
-0.1% |
|
AFTERPAY |
Information Technology |
1.1% |
1.2% |
-0.1% |
|
COLES GROUP |
Consumer Staples |
1.1% |
1.2% |
-0.1% |
|
SYDNEY AIRPORT |
Industrials |
1.1% |
1.1% |
0.0% |
|
NEWCREST MINING |
Materials |
0.9% |
0.9% |
0.0% |
Source: IRESS, VanEck, 8 December 2021
Figure 2: Top 20 Holdings Post (BHP +4.2%)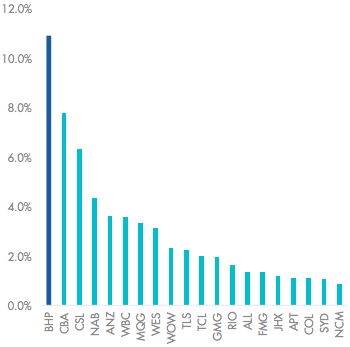
Source: IRESS, VanEck, 8 December 2021
The unification would also change the sector weights within the S&P/ASX 200, primarily in materials that would increase by 4.2 per cent taken mostly from financials and healthcare. It is expected financials will still make up a significant 28.27% of the index, while materials would rise to now be 23.19% of the index. Therefore, these two sectors would represent over 50% of the market, up from their 47% allocation now.
Figure 3: S&P/ASX 200 Sector changes before and after BHP unification (Materials +4.2%)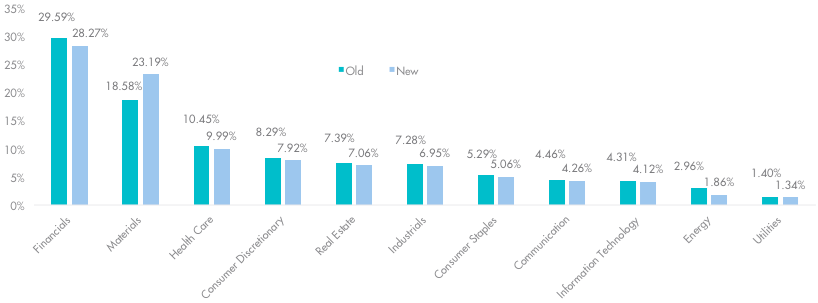
Source: IRESS, VanEck, 8 December 2021
Reduce concentration risk
Investors seeking diversification need to consider looking beyond portfolios that track or are benchmarked to the S&P/ASX 200.
VanEck Australian Equal Weight ETF (MVW) equally weights the largest and most liquid stocks on the ASX at each rebalance. As a result, it is underweight the broader big banks and other mega-caps, relative to the S&P/ASX 200. As at 30 November 2021, MVW’s portfolio is underweight financials by 12.58% and mega-caps by 18.47%, and overweight large-cap (+12.07) and mid-cap (+6.62%) stocks.
Figure 4: GICS Sector Weight Differential: MVW vs S&P/ASX 200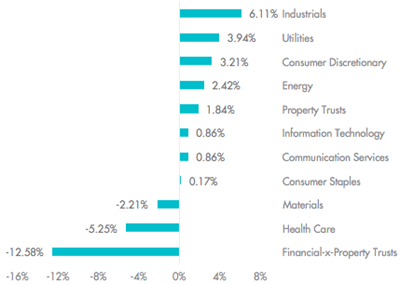
Figure 5: Market cap weight differential: MVW vs S&P/ASX 200
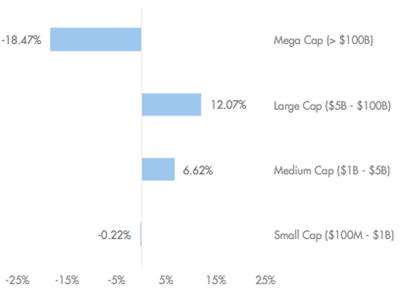
Figures 4 and 5 calculated by subtracting S&P/ASX 200 Index from respective MVW sector weights; positive differentials indicate greater MVW weight in the sector. Source: VanEck, FactSet; as at 30 November 2021.
A way to calculate concentration
The Herfindahl index is a measure we have used to calculate market concentration. The lower the Herfindahl index the better, as a lower index number signifies less concentration and greater diversification. The Herfindahl for S&P/ASX 200 is 264. For MVW it is 105. By this measure, the MVW Index is over 2 times more diversified than the S&P/ASX 200.
Exposure to the reopening
While governments and central banks around the world continuing to provide loose monetary and fiscal policies supporting risk assets a diversified allocation to equities remains important. Further, as governments commit to remaining open it is expected that the Australian economy will start to bounce back as in parts of Europe in the US. Those companies that will benefit most from the reopening of the economy are likely to be outside the top 20.
Fundamentals
|
|
MVW |
S&P/ASX 200 |
|
Return on Equity (ROE) (%) |
10.69 |
13.78 |
|
LT Debt to Capital (%) |
31.79 |
38.17 |
|
Hist 3Yr Sales Growth (%) |
5.4 |
4.3 |
|
Price to Earnings (x) |
18.8 |
16.6 |
|
Price to Book (x) |
2.04 |
2.30 |
|
Price to Sales (x) |
2.00 |
2.62 |
|
EV/EBITDA (x) |
34.63 |
53.35 |
|
Trailing Dividend Yield (%) |
3.08 |
3.62 |
|
Payout Ratio (%) |
86.33 |
85.45 |
Source: FactSet, as at 6 December 2021. Past performance is not indicative of future performance.
All of this further strengthens the case for equal weight approach to Australian equities.
The VanEck Australian Equal Weight ETF (MVW) equally weights 95 of the largest and most liquid stocks on ASX, it is underweight mega-caps relative to portfolios that track or are benchmarked to the S&P/ASX 200.
MVW is an award-winning strategy that provides:
- Diversification – close to 2 ½ times more diversified than the S&P/ASX 200, as measured by the Herfindahl Index.
- Style – equal weighting is compelling in Australia and blends well with other high conviction stock/manager satellite positions, without creating too much overlap.
- Consistency – this is a rules based strategy, no manager views, no single stock bets.
- Cost effective – 0.35% p.a. management costs which is much lower than active Australian equities managers’ (almost 1/3 the average), allowing investors to reduce total portfolio costs.


Published: 14 December 2021
VanEck Investments Limited (ACN 146 596 116 AFSL 416755) (‘VanEck’) is the issuer and responsible entity of all VanEck exchange trades funds (Funds) listed on the ASX. This is general advice only and does not take into account any person’s financial objectives, situation or needs. The product disclosure statement (PDS) and the target market determination (TMD) for all Funds are available at vaneck.com.au. You should consider whether or not an investment in any Fund is appropriate for you. Investments in a Fund involve risks associated with financial markets. These risks vary depending on a Fund’s investment objective. Refer to the applicable PDS and TMD for more details on risks. Investment returns and capital are not guaranteed.
View Index provider disclaimers. Index providers for VanEck funds do not sponsor, endorse or promote the funds.