Australia reopens
The Australian government has announced a three stage easing of lockdown restrictions so now investors’ focus is on the rate of recovery in economic activity.
With sparse company earnings guidance investors are looking at broad activity indicators such as grocery visits, workplace returns and public transport use and restaurant reservations.

The Australian government has announced a three stage easing of lockdown restrictions so now investors’ focus is on the rate of recovery in economic activity.
With sparse company earnings guidance investors are looking at broad activity indicators such as:
-
- Grocery visits;
- Workplace returns and public transport use; and
- Restaurant reservations.
Business confidence and conditions remain low but consumer confidence has bounced back from April lows. The labour market and the extent of the structural job losses are also key to the Australian recovery. While it is still uncertain as to what will happen in coming months, a review of performance during the recovery illustrates that a broad Australian equities exposure may be best suited to the uncertain recovery.
Australia re-emerges
After a National Cabinet meeting in May, Prime Minister Scott Morrison announced a three step framework for reopening the Australian economy. While each state will be responsible for the speed of easing restrictions the roadmap to recovery appears to have been welcomed by investors. During the lockdown a number of companies suspended or deferred dividends. Earnings guidance announcements were scant so investors have been analysing real time indicators to determine activity and the rate of recovery.
There has been some recovery in some measures, but they are still at low levels.
Summary of real-time indicators 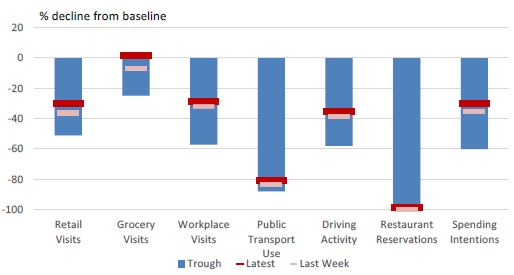
Source: Apple, ANZ, Citymapper, Google, Opentable, Morgan Stanley Research
While consumer sentiment has risen, albeit from a historically low base, business conditions continue to deteriorate to their worst ever levels. 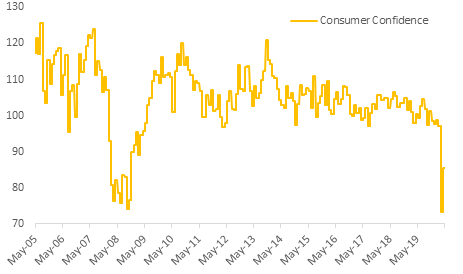
Source: Westpac, Bloomberg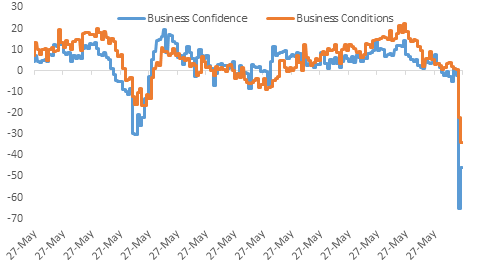
Source: NAB, Bloomberg
Business conditions vary by sector.
Business Conditions by Industry, Latest Month (Trend)
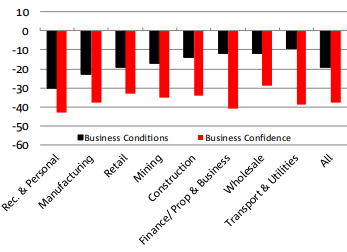
Source: NAB
And this has led to disparate performance between sectors and stocks on ASX over the past few months. For example: in February, IT was the worst performer, but so far in May it has been a standout; and in March communication services was the worst performer but the best performer in April.
|
Returns |
May MTD |
April |
March |
February |
|
S&P/ASX 200 |
4.70% |
8.78% |
-20.65% |
-7.69% |
|
Financials |
5.76% |
2.83% |
-27.64% |
-4.89% |
|
Materials |
6.35% |
14.23% |
-13.04% |
-11.74% |
|
Health Care |
-2.80% |
4.38% |
-5.37% |
-3.73% |
|
Industrials |
3.92% |
12.47% |
-22.48% |
-8.20% |
|
Consumer Staples |
-1.80% |
2.39% |
-35.60% |
-4.57% |
|
Real Estate |
8.95% |
14.17% |
-3.72% |
-8.64% |
|
Consumer Discretionary |
8.16% |
15.95% |
-25.89% |
-7.13% |
|
Energy |
7.03% |
5.73% |
-16.04% |
-17.20% |
|
Communication Services |
7.28% |
24.93% |
-37.53% |
-8.62% |
|
Information Technology |
14.18% |
22.52% |
-17.86% |
-17.28% |
|
Utilities |
1.00% |
2.74% |
-6.22% |
-3.62% |
Source: Factset
The importance of a balanced exposure to the Australian economy
As investors ponder the easing of lockdown restrictions, it will be important that portfolios have exposure to all parts of the local economy. One way to do this is by applying an “equal weight” strategy to the largest and most liquid stocks on the ASX. This approach provides true diversification across securities and market sectors reducing concentration risk.
Equal weighting during recoveries
The increased diversification of an equal weight strategy has led to outperformance over the long term. The MVIS Australia Equal Weight Index has a history back to 2002. You can see below how it has outperformed since its inception and particularly in rising markets.
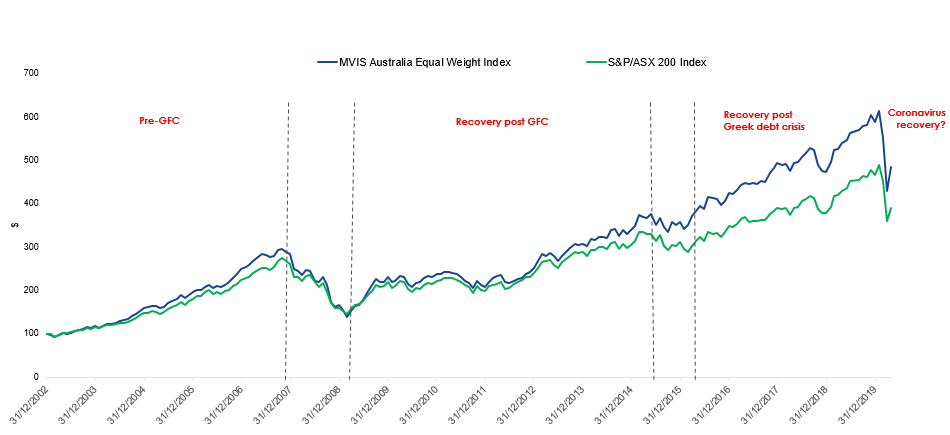
Source: VanEck, Bloomberg, FactSet; as at 30 April 2020. Rebased to 100. The above chart represents past performance of indices and not MVW. Index performance is not illustrative of fund performance. You cannot invest directly in an index. Index returns assume dividends are immediately reinvested and exclude management fees and costs incurred when investing in the fund. Past performance of the MVIS Australia Equal Weight Index is not a reliable indicator of future performance of MVW.
If we focus in on the periods after a significant downturn you can see the MVIS Australia Equal Weight Index recovers faster than the broader market, including following the COVID-19 market correction.
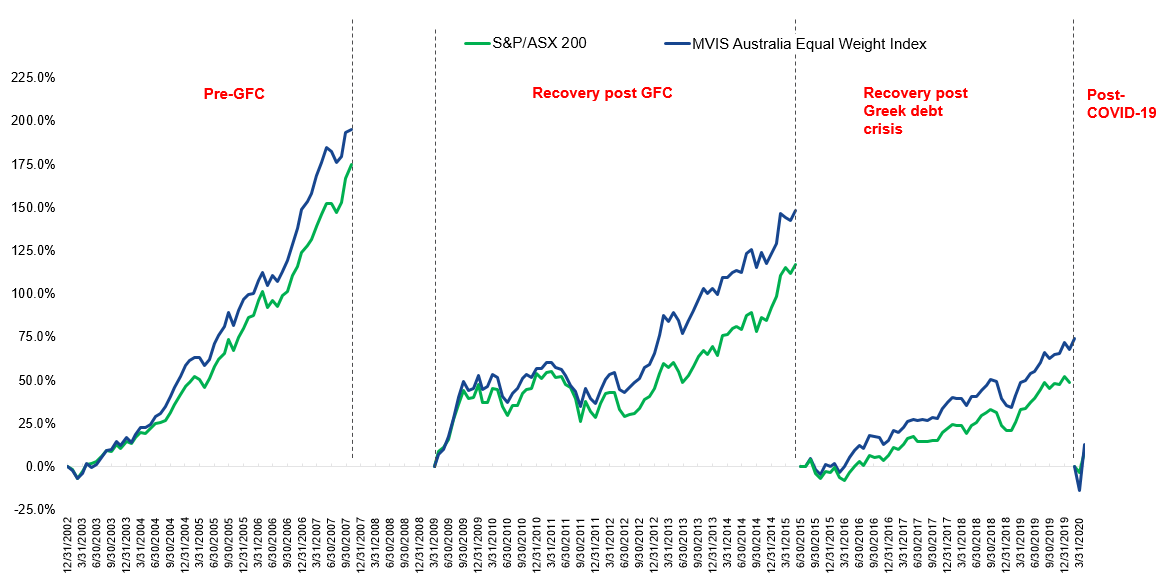
Source: VanEck, Bloomberg, FactSet; as at 30 April 2020. The above chart represents past performance of indices and not MVW. Index performance is not illustrative of fund performance. You cannot invest directly in an index. Index returns assume dividends are immediately reinvested and exclude management fees and costs incurred when investing in the fund. Past performance of the MVIS Australia Equal Weight Index is not a reliable indicator of future performance of MVW.
Find out how you can take an equal weight approach to the S&P/ASX 200.


Published: 01 June 2020